Beyond the Buzzwords: The Strategic Power of Well-Chosen KPIs
In a data-saturated business environment, not all metrics are created equal. The critical difference between accelerated growth and operational stagnation often hinges on selecting and tracking the right Key Performance Indicators (KPIs). These are more than just figures on a report; they are the vital signs of your business, offering a clear, quantifiable measure of progress toward your most important strategic goals. Many organizations fall into the trap of monitoring "vanity metrics," which appear impressive but fail to provide actionable insight into performance or future outcomes.
This guide is designed to cut through the noise. We will move beyond basic definitions to deliver a deep strategic analysis of powerful key performance indicators examples relevant to finance, sales, marketing, and operations. For each KPI, we will dissect the "what," "why," and "how," providing the specific formula, typical industry benchmarks, and, most importantly, the strategic decisions you can make based on the data.
You will learn not just how to calculate metrics like Customer Lifetime Value (CLV) or Inventory Turnover, but how to interpret them within your unique business context. The goal is to equip you with the knowledge to transform raw numbers into a clear narrative about your company's health and trajectory. We will explore how to extract actionable takeaways that drive smarter, data-backed decisions, turning complex analytics into a distinct competitive advantage. This list provides the tactical detail necessary to move from simply tracking data to strategically using it for tangible business improvement.
1. Customer Lifetime Value (CLV)
Customer Lifetime Value (CLV) stands as one of the most vital key performance indicators examples for sustainable business growth. It represents the total net profit a company can expect to generate from a single customer throughout their entire relationship with the brand. By moving beyond single-transaction metrics, CLV provides a long-term perspective on customer profitability.
This forward-looking KPI is crucial for making strategic decisions. It directly informs how much you can afford to spend on customer acquisition (Customer Acquisition Cost, or CAC) while remaining profitable. A high CLV indicates strong customer loyalty and retention, justifying greater investment in marketing and service to acquire similar high-value customers. For example, a SaaS company with a high CLV can justify a longer, more expensive sales cycle, while an e-commerce brand can invest more in retaining customers through loyalty programs.
Strategic Analysis and Implementation
Companies like Starbucks masterfully leverage CLV to drive their loyalty programs. The Starbucks Rewards app isn't just about free coffee; it’s a data-gathering engine designed to increase purchase frequency and average order value, directly boosting CLV. They analyze purchasing habits to offer personalized promotions that encourage customers to return more often or try higher-margin products.
Similarly, Netflix uses complex CLV models to justify its massive content acquisition and production budgets. By understanding the predicted lifetime value of a subscriber, Netflix can calculate the ROI of a new show. If a new series is predicted to attract and retain subscribers whose collective CLV exceeds the show's cost, the investment is strategically sound.
The infographic below illustrates a foundational method for calculating CLV, breaking it down into a clear, three-step process.
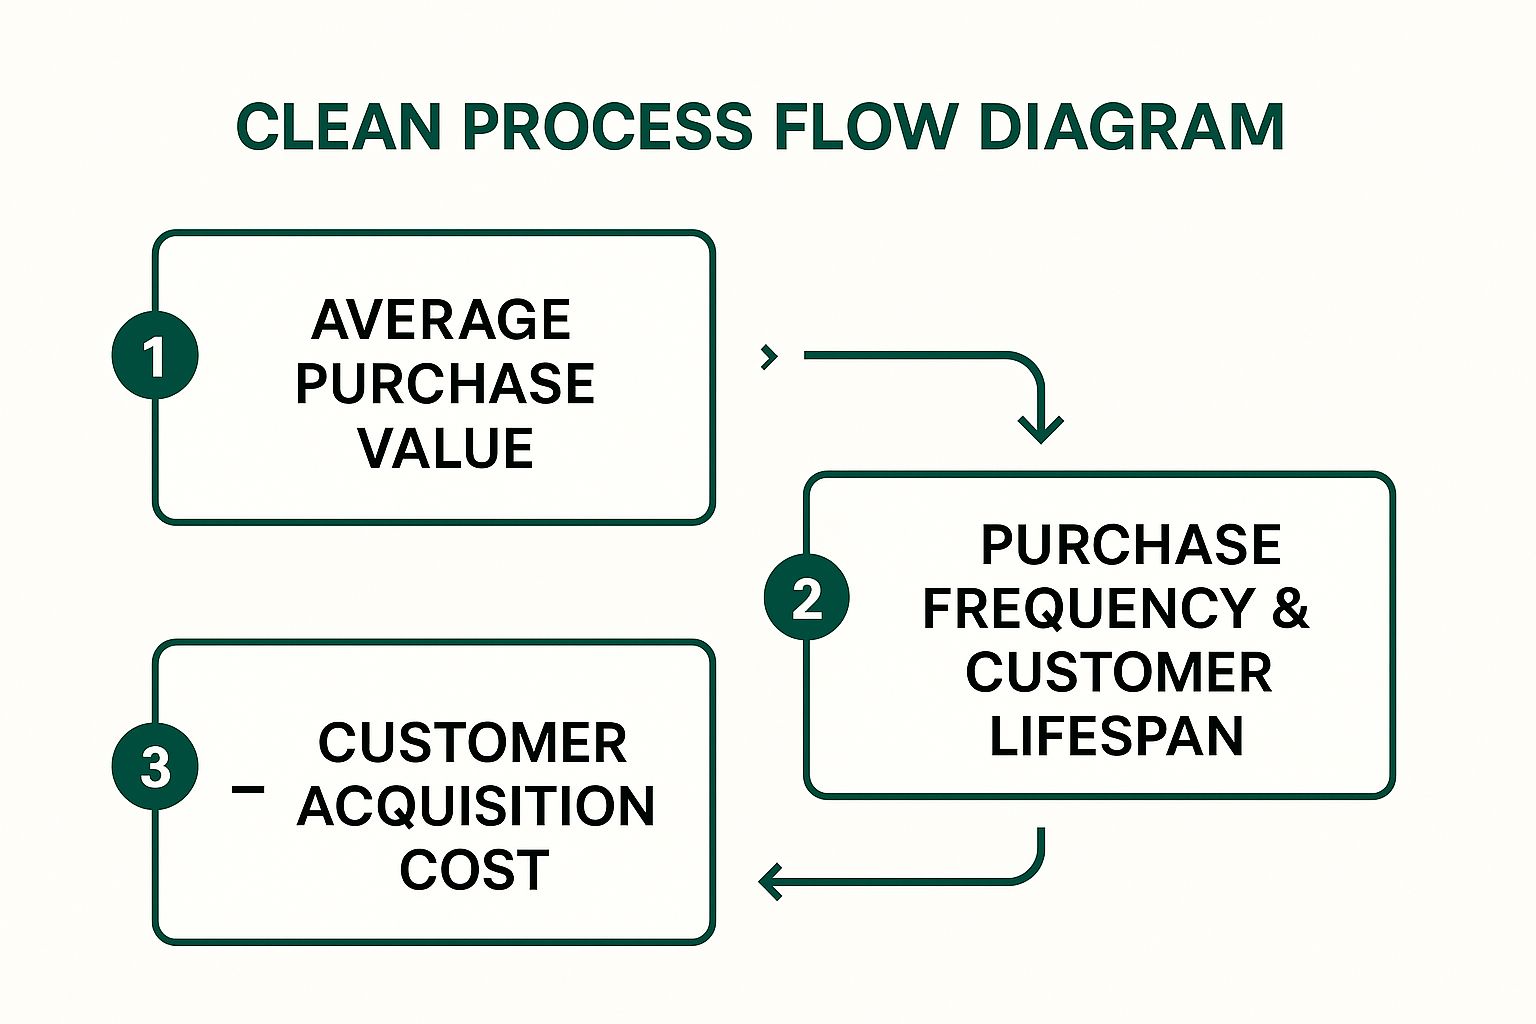
This process highlights how multiplying average purchase value by frequency and lifespan estimates gross value, from which acquisition costs are subtracted to find the net lifetime value.
Actionable Takeaways
To effectively implement CLV, start with a simple calculation model before moving to more complex predictive analytics.
- Segment Your Customers: Don't use a single CLV for your entire customer base. Group customers by acquisition channel, first purchase, or demographic data for more precise insights.
- Set CAC Limits: Use your CLV-to-CAC ratio to define your marketing budget. A healthy ratio is typically considered to be 3:1 or higher.
- Focus on Retention: Analyze the behaviors of your highest-CLV customers and create marketing and service initiatives to replicate those behaviors in other segments.
For a deeper dive into understanding and applying CLV, this video provides a comprehensive overview.
2. Net Promoter Score (NPS)
Net Promoter Score (NPS) is a widely adopted metric among the most insightful key performance indicators examples, designed to measure customer loyalty and satisfaction. It gauges the likelihood of customers recommending a company’s products or services by asking a single, powerful question: "On a scale of 0-10, how likely are you to recommend our brand to a friend or colleague?" Based on their response, customers are categorized as Promoters (9-10), Passives (7-8), or Detractors (0-6).

The score itself is a simple calculation: the percentage of Detractors is subtracted from the percentage of Promoters. This results in a score ranging from -100 to +100. A positive NPS is generally considered good, while scores above 50 are excellent. NPS provides a clear, standardized benchmark for tracking customer sentiment over time and comparing performance against competitors. It serves as a leading indicator of business growth, as satisfied Promoters often become a powerful, organic marketing engine.
Strategic Analysis and Implementation
Companies renowned for their customer-centric cultures, like Apple and Tesla, strategically leverage NPS to maintain their competitive edge. Apple consistently achieves NPS scores above 70 by integrating customer feedback directly into its product development and retail experience. Feedback from Detractors can pinpoint specific issues with a device or a service interaction, allowing for targeted improvements that enhance the overall customer journey.
Similarly, Tesla uses its industry-leading NPS as more than just a vanity metric. It acts as a core driver for its direct-to-consumer model, relying on word-of-mouth advocacy from its base of Promoters to fuel sales without a traditional advertising budget. When Southwest Airlines uses NPS, it focuses on identifying service friction points. By analyzing feedback from Detractors, they can address issues like boarding processes or in-flight service, directly linking customer feedback to operational enhancements.
Actionable Takeaways
To use NPS effectively, go beyond the score and integrate the feedback into your operational rhythm.
- Segment NPS Data: Analyze scores by customer demographics, geographic location, or specific touchpoints (e.g., post-purchase, after a support call) to identify specific areas of strength and weakness.
- Close the Loop: Implement a process to follow up with respondents. Thank Promoters and learn what they love, but most importantly, contact Detractors promptly to understand their concerns and resolve their issues. This can turn a negative experience into a positive one.
- Track Trends, Not Snapshots: A single NPS score has limited value. The real insight comes from tracking your NPS over time to see the impact of your strategic initiatives on customer loyalty.
3. Monthly Recurring Revenue (MRR)
Monthly Recurring Revenue (MRR) is a foundational metric among key performance indicators examples, especially for subscription-based businesses. It measures the predictable and normalized revenue a company can expect to receive every month. By converting all subscription terms, whether annual, quarterly, or monthly, into a consistent monthly figure, MRR provides a clear view of financial stability and growth trajectory.
This KPI is indispensable for strategic financial planning and valuation in the SaaS industry and beyond. It allows businesses to forecast cash flow with greater accuracy and understand the momentum of their revenue engine. A steadily growing MRR signals a healthy, scalable business model, attracting investors and informing decisions on hiring, product development, and marketing spend. For instance, a rising MRR confirms that new customer acquisition and upselling efforts are outpacing churn and downgrades.
Strategic Analysis and Implementation
Software giants like Salesforce meticulously track MRR not just as a total figure but segmented across its various product clouds (e.g., Sales Cloud, Service Cloud). This granular analysis helps them identify which products are driving growth and where to allocate more R&D and sales resources. This approach allows them to manage a diverse portfolio and make informed decisions on product bundling and pricing strategies.
Similarly, Adobe’s successful transition from selling perpetual software licenses to the Creative Cloud subscription model was guided by MRR. By focusing on this KPI, Adobe could demonstrate to stakeholders the long-term value and stability of its new model, even when it meant a short-term dip in upfront revenue. This focus on predictable income streams completely reshaped its business and market valuation.
Actionable Takeaways
To leverage MRR effectively, you must look beyond the single top-line number and dissect its components.
- Segment Your MRR: Break down MRR into new business, expansion (from upsells/cross-sells), and churned (lost) revenue. This provides a clear picture of what's driving your growth.
- Track Growth Rate: Monitor your month-over-month MRR growth rate. This percentage is often more insightful for understanding business momentum than the absolute dollar value.
- Analyze Cohorts: Group customers by the month they signed up and track their MRR contribution over time. Cohort analysis reveals crucial trends in customer lifetime value and retention.
4. Customer Acquisition Cost (CAC)
Customer Acquisition Cost (CAC) is a fundamental metric among key performance indicators examples, quantifying the total expense required to acquire a new customer. It is calculated by dividing all sales and marketing costs by the number of new customers gained over a specific period. CAC provides a clear, hard number on the efficiency of a company’s growth engine.
This KPI is essential for assessing the profitability and sustainability of a business model. A high CAC might indicate inefficient marketing spend or a highly competitive market, while a low CAC suggests effective strategies. It works in tandem with Customer Lifetime Value (CLV); the CAC-to-CLV ratio is a critical health indicator for subscription-based businesses and startups, revealing whether their customer acquisition strategy is financially viable in the long run.
Strategic Analysis and Implementation
Companies renowned for growth have mastered CAC optimization. Dropbox, for instance, famously sidestepped high traditional marketing costs by engineering a viral referral program. Offering free additional storage to both the referrer and the new user created a low-cost, word-of-mouth acquisition channel, dramatically reducing their CAC and fueling exponential growth in their early stages.
HubSpot, a leader in inbound marketing, takes a more granular approach. They meticulously track CAC per marketing channel, such as organic search, paid ads, and social media. This allows them to identify which channels deliver the most cost-effective customers. By reallocating their budget toward high-performing channels and away from less efficient ones, HubSpot continuously optimizes its marketing spend for maximum ROI.
Actionable Takeaways
To use CAC effectively, you must move beyond a simple, company-wide average and dig into the specifics of your acquisition efforts.
- Calculate Channel-Specific CAC: Determine the cost to acquire a customer through each distinct channel (e.g., Google Ads, content marketing, affiliate programs). This reveals which channels are truly profitable.
- Include Fully-Loaded Costs: For an accurate CAC, ensure you include all associated expenses, not just ad spend. This means factoring in salaries of marketing and sales staff, software costs, and relevant overhead.
- Maintain a Healthy CAC to CLV Ratio: A widely accepted benchmark for a sustainable business is a CLV-to-CAC ratio of at least 3:1. This means for every dollar spent acquiring a customer, you generate at least three dollars in lifetime value.
5. Conversion Rate
Conversion Rate is a cornerstone among key performance indicators examples, measuring the percentage of users who complete a desired action out of the total number of users who had the opportunity. This fundamental digital marketing metric is not limited to sales; it can track email sign-ups, form completions, or any other defined goal. It directly measures the effectiveness of your marketing campaigns, website design, and overall user experience.

A high conversion rate signifies that your messaging, offer, and user journey are aligned with your audience's expectations, leading to efficient performance. For example, an e-commerce store with a high checkout conversion rate has an effective and frictionless payment process. Conversely, a low rate highlights a point of friction or a disconnect that needs immediate attention, making it an essential diagnostic tool for business optimization.
Strategic Analysis and Implementation
Amazon is a master of conversion rate optimization (CRO), constantly A/B testing every element on its product pages, from button colors to review layouts. Each test is designed to remove friction and incrementally increase the likelihood of a purchase. This relentless focus on conversion is a key driver of its market dominance.
Similarly, Shopify merchants live and die by their conversion rates. They analyze funnel data to see where users drop off, whether it's on the product page, the cart, or during checkout. Using this data, they can implement changes like adding new payment options, simplifying the checkout form, or improving product imagery to boost the percentage of visitors who become paying customers.
Actionable Takeaways
To effectively leverage Conversion Rate, you must move beyond a single, site-wide number and dig into the specifics of user behavior.
- Define Clear Conversion Goals: Ensure every campaign or web page has a specific, measurable primary goal. Also, track micro-conversions (e.g., adding an item to a cart) to understand the steps leading to the main goal.
- Segment Your Data: Analyze conversion rates by traffic source (e.g., organic search vs. social media), device type, and user demographics. This will reveal which channels and audiences are most effective.
- Implement Systematic Testing: Use A/B testing to methodically test changes to headlines, calls-to-action, images, and page layouts. Only change one element at a time to isolate its impact on performance.
Tracking these granular metrics over time can be complex, but it's crucial for informed decision-making. You can explore creating a KPI dashboard in a familiar tool to consolidate and monitor these metrics by reviewing our guide on building an Excel KPI dashboard.
6. Employee Net Promoter Score (eNPS)
Employee Net Promoter Score (eNPS) is one of the most direct key performance indicators examples for measuring employee loyalty and engagement. It adapts the customer-centric Net Promoter Score (NPS) framework for an internal audience, gauging how likely employees are to recommend their organization as a place to work. This simple yet powerful metric provides a quick pulse check on workplace culture and employee sentiment.
The eNPS is calculated by asking one primary question: "On a scale of 0-10, how likely are you to recommend [Company Name] as a workplace to a friend or colleague?" Based on their responses, employees are categorized as Promoters (9-10), Passives (7-8), or Detractors (0-6). The final score is the percentage of Promoters minus the percentage of Detractors. A high eNPS is a strong indicator of a healthy company culture, which correlates with lower turnover, higher productivity, and better customer service.
Strategic Analysis and Implementation
Tech giants like Google and Microsoft rely heavily on eNPS to monitor their organizational health. Google integrates eNPS into its comprehensive employee feedback system, using the score as a trigger to investigate specific issues within teams or departments that show low engagement. This allows them to address problems proactively before they escalate into wider talent retention issues.
Similarly, Microsoft tracks eNPS as a core KPI to measure the success of its ongoing cultural transformation. By monitoring the score's trends over time, leadership can assess whether its initiatives are genuinely improving the employee experience. Zappos, known for its unique culture, uses eNPS not just as a metric but as a conversation starter, following up surveys with deep-dive discussions to understand the "why" behind the scores.
Actionable Takeaways
To effectively use eNPS, it must be part of a broader feedback and action loop. Simply measuring the score is not enough.
- Segment Your Results: Analyze eNPS scores by department, team, tenure, and role. This segmentation reveals specific hotspots of disengagement and allows for targeted interventions.
- Follow Up with Qualitative Feedback: The score tells you "what," but you need qualitative data to understand "why." Follow up the survey with open-ended questions or small group discussions to gather context from Detractors and learn best practices from Promoters.
- Act and Communicate Transparently: Share the anonymized results with your employees, along with a clear action plan addressing the feedback. This demonstrates that their voices are heard and valued, which can itself improve engagement.
7. Gross Margin
Gross Margin is a fundamental profitability metric and a critical one among key performance indicators examples. It reveals the percentage of revenue left after subtracting the cost of goods sold (COGS). This KPI offers a clear view of how efficiently a company produces its goods or services, providing vital insights into pricing strategy, production efficiency, and the core profitability of its business model before accounting for operating expenses.
This foundational KPI is essential for assessing a company's financial health at the production level. A high gross margin signals strong pricing power and efficient cost management, allowing more funds to cover operating, marketing, and administrative costs. For example, a software company like Microsoft can achieve gross margins over 65% because the cost to sell an additional software license is negligible. In contrast, a high-volume retailer like Costco operates on razor-thin gross margins (around 10-14%), relying on massive scale and membership fees for overall profitability.
Strategic Analysis and Implementation
Apple masterfully manages its high gross margin (often 38-42%) as a core strategic pillar. It achieves this through a combination of premium pricing, supply chain control, and brand equity that commands customer loyalty. By controlling both the hardware and software ecosystems, Apple optimizes its COGS and maintains a perception of value that justifies its high prices, directly protecting its margin.
Conversely, the automotive industry often sees thinner margins and uses this KPI to make critical production and pricing decisions. A car manufacturer will analyze gross margin per model line to determine which vehicles are most profitable. If a specific model's margin is declining, they might explore cost-saving measures in production, renegotiate supplier contracts, or adjust the vehicle's sticker price to protect profitability.
Actionable Takeaways
To effectively use gross margin as a strategic tool, you must look beyond the single, company-wide number.
- Analyze by Product Line: Calculate and track gross margin for individual products, services, or customer segments. This can reveal which offerings are true profit drivers and which may be underperforming or even losing money.
- Track Trends Over Time: A declining gross margin is an early warning sign of potential issues, such as rising material costs, decreasing pricing power, or production inefficiencies. Monitor this trend monthly or quarterly.
- Benchmark Against Competitors: Compare your gross margin to industry averages and key competitors. This provides context for your performance and helps set realistic targets for improvement in operational efficiency.
8. Website Traffic (Unique Visitors)
Website Traffic, specifically the count of unique visitors, is a foundational digital marketing KPI. It measures the number of distinct individuals who have visited a website within a given period, such as a day, week, or month. Unlike total visits or pageviews, this metric doesn't count repeat visits from the same person, offering a clear picture of your website’s actual reach and its ability to attract a new audience.
This KPI is a primary indicator of brand awareness and the top-of-funnel effectiveness of your marketing campaigns. A rising number of unique visitors suggests that your SEO, content marketing, social media, or paid advertising strategies are successfully driving discovery. For an e-commerce site, more unique visitors means more potential customers. For a B2B company, it indicates a larger pool of potential leads learning about your solutions.
Strategic Analysis and Implementation
Global giants like Amazon track their incredible volume of unique visitors, over 2.7 billion monthly, not just as a vanity metric but as the primary pool for conversion. Each visitor represents an opportunity to convert a sale, gather data, or upsell a Prime membership. Their entire digital infrastructure is optimized to guide this massive flow of traffic toward a purchase.
Similarly, a content-driven platform like Netflix scrutinizes unique visitor data to its non-subscriber landing pages. They analyze which content trailers, blog posts, or promotional offers are most effective at converting a unique visitor into a trial sign-up or a full subscription. This data directly informs their content marketing and user acquisition budgets, ensuring they are attracting an audience that is likely to convert. Even small local businesses rely on this metric to gauge the success of their local SEO efforts, seeing a direct correlation between unique visitor growth and increased foot traffic or phone calls.
Actionable Takeaways
To effectively leverage unique visitor data, move beyond just tracking the total number and start segmenting the information for deeper insights.
- Segment by Traffic Source: Analyze which channels (e.g., organic search, social media, direct, referral) bring in the most unique visitors. Allocate more resources to your highest-performing channels.
- Track New vs. Returning Visitors: A healthy ratio of new to returning visitors indicates both successful acquisition and strong engagement. If new visitors are high but returning visitors are low, focus on improving site experience and content value.
- Focus on Quality, Not Just Quantity: Pair unique visitor counts with engagement metrics like bounce rate, time on page, and conversion rate. High traffic with poor engagement signals a mismatch between your audience and your content or offering.
9. Inventory Turnover Rate
The Inventory Turnover Rate is a critical efficiency ratio and one of the most powerful key performance indicators examples for businesses managing physical goods. It quantifies how many times a company has sold and replaced its inventory over a specific period, such as a quarter or a year. This metric provides a clear lens into how effectively management is converting inventory into sales.
A high turnover rate generally signals strong sales and efficient inventory management, minimizing storage costs and reducing the risk of obsolescence. Conversely, a low rate may indicate weak sales, overstocking, or issues within the supply chain. This KPI is essential for retail, manufacturing, and distribution companies to optimize cash flow, as inventory represents a significant capital investment tied up in assets.
Strategic Analysis and Implementation
Retail giants like Walmart have built their empires on the foundation of efficient inventory management, consistently achieving an inventory turnover rate of around 8 to 9 times per year. This is accomplished through a sophisticated supply chain, just-in-time inventory systems, and powerful data analytics that forecast demand with high accuracy, ensuring products move quickly from warehouses to customers.
Another prime example is Zara, whose fast-fashion model relies on an exceptionally high turnover, often exceeding 12 times annually. Zara intentionally produces small batches of new styles, creating scarcity and encouraging immediate purchase. This strategy allows them to rapidly respond to changing fashion trends, minimize markdowns on unsold stock, and maintain a fresh and appealing product offering, directly fueling their high turnover rate.
Actionable Takeaways
To effectively use the Inventory Turnover Rate, you must look beyond the single, company-wide number and dig into the details.
- Analyze by Category: A company-wide average can hide problems. Segment your turnover rate by product category, SKU, or supplier to identify both fast-moving winners and slow-moving products that are tying up capital.
- Factor in Seasonality: For many businesses, sales fluctuate throughout the year. Calculate turnover on a quarterly or even monthly basis to understand seasonal trends and adjust your purchasing and stocking strategies accordingly.
- Balance Turnover and Stockouts: While a high turnover is desirable, an excessively high rate can indicate under-stocking, leading to lost sales and dissatisfied customers. Aim for a healthy balance that meets demand without carrying excess inventory. To enhance your inventory management processes, you can learn more about inventory management Excel templates.
10. Return on Investment (ROI)
Return on Investment (ROI) is a cornerstone financial metric and one of the most fundamental key performance indicators examples used to assess profitability. It quantifies the efficiency of an investment by comparing the net gain against the initial cost. Expressed as a percentage, ROI provides a universal benchmark to evaluate and compare the performance of different ventures, from marketing campaigns to capital expenditures.
This powerful KPI is indispensable for resource allocation and strategic planning. It answers the critical business question: "For every dollar invested, what did we get back?" A positive ROI signifies a profitable initiative, while a negative one indicates a loss. For instance, a marketing team uses ROI to determine which advertising channels yield the highest returns, while a company’s leadership evaluates the ROI of a new software implementation to confirm it generates more value than it costs.
Strategic Analysis and Implementation
Companies across all sectors rely on ROI to validate their spending. A real estate investor calculates ROI to compare the profitability of different properties, factoring in rental income, appreciation, and expenses against the purchase price and renovation costs. This allows them to allocate capital to the assets with the highest potential returns.
Similarly, a B2B technology company uses ROI analysis to justify major infrastructure upgrades. By projecting the efficiency gains, reduced operating costs, and increased revenue enabled by the new technology, they can present a clear business case. If the projected financial benefits significantly outweigh the implementation and training costs, the investment is approved. This disciplined approach ensures that capital is deployed effectively to drive growth and operational excellence.
Actionable Takeaways
To use ROI effectively, you must establish clear and consistent measurement standards.
- Define Clear Parameters: Before calculating, precisely define what constitutes both "cost" and "return." Costs should include all direct and indirect expenses, such as labor, materials, and overhead. Returns can include direct revenue, cost savings, and productivity gains.
- Calculate Over Multiple Time Periods: A short-term ROI might not capture the full picture. Calculate ROI at different intervals (e.g., 6 months, 1 year, 3 years) to understand the investment's long-term value.
- Benchmark Against Alternatives: ROI is most powerful when used for comparison. Evaluate a project's ROI against the potential returns of other investment opportunities (opportunity cost) to ensure you are making the best choice.
For those looking to streamline their financial analysis, you can learn more about how to automate financial reporting to make ROI calculations faster and more accurate.
Key Metrics Comparison Overview
| Metric | Implementation Complexity 🔄 | Resource Requirements ⚡ | Expected Outcomes 📊 | Ideal Use Cases 💡 | Key Advantages ⭐ |
|---|---|---|---|---|---|
| Customer Lifetime Value (CLV) | High – requires historical data & complex calculation | High – data-intensive, predictive modeling | Long-term customer value prediction & improved marketing ROI | Customer segmentation, marketing budget allocation, retention strategies | Guides acquisition costs, prioritizes high-value customers |
| Net Promoter Score (NPS) | Low – simple single-question survey | Low – minimal data collection | Customer loyalty measurement & growth prediction | Customer satisfaction, loyalty programs, benchmarking | Easy to implement, provides clear actionable insights |
| Monthly Recurring Revenue (MRR) | Medium – requires subscription tracking & data normalization | Medium – subscription billing and tracking systems | Predictable revenue forecasting & growth analysis | SaaS, subscription businesses, financial planning | Accurate revenue forecasting, growth and churn monitoring |
| Customer Acquisition Cost (CAC) | Medium – requires cost tracking across channels | Medium – sales and marketing cost data | Marketing efficiency and budget optimization | Marketing ROI analysis, unit economics, pricing strategy | Measures sales/marketing efficiency, guides budgeting |
| Conversion Rate | Low – straightforward ratio calculation | Low – requires tracking user actions | Immediate feedback on marketing & UX effectiveness | Digital marketing campaigns, e-commerce, funnel optimization | Simple to calculate, enables A/B testing and optimization |
| Employee Net Promoter Score (eNPS) | Low – single-question survey | Low – employee feedback collection | Employee loyalty and engagement measurement | HR engagement programs, workplace culture improvement | Quick implementation, predicts turnover, tracks engagement trends |
| Gross Margin | Medium – financial calculation based on revenue and COGS | Medium – accounting systems and sales data | Profitability and operational efficiency insight | Pricing strategies, cost management, financial benchmarking | Clear operational efficiency indicator, pricing evaluation |
| Website Traffic (Unique Visitors) | Low – analytics tool tracking | Low – web analytics tools | Measures true audience reach and brand awareness | Digital marketing, brand exposure, SEO analysis | Easy to understand, fundamental for digital presence metrics |
| Inventory Turnover Rate | Medium – requires inventory and COGS tracking | Medium – inventory and financial data | Inventory management efficiency and capital utilization | Retail, supply chain management, inventory optimization | Identifies slow-moving stock, benchmarks inventory efficiency |
| Return on Investment (ROI) | Low to Medium – simple formula but needs accurate cost/gain data | Low to Medium – depends on data availability | Investment efficiency and profitability comparison | Marketing campaigns, capital investments, project evaluation | Universal metric, easy to compare and prioritize investments |
From Measurement to Mastery: Activating Your KPIs
We have journeyed through a comprehensive catalog of key performance indicators examples, dissecting everything from the customer-centric focus of Net Promoter Score (NPS) and Customer Lifetime Value (CLV) to the operational precision of Inventory Turnover Rate and the financial clarity of Gross Margin and ROI. Understanding the definitions, formulas, and strategic applications of these metrics is a foundational step. However, the true transformation for any business or department lies not in the knowing but in the doing. The goal is to evolve from passive measurement to active mastery, where data seamlessly fuels strategic decisions and drives tangible outcomes.
The core challenge for many mid-level managers, department heads, and analysts is not a scarcity of data. It's the operational bottleneck of translating that data into timely, actionable intelligence. The process of manually calculating, cross-referencing, and visualizing these KPIs can be incredibly time-consuming, often trapping valuable team members in a cycle of spreadsheet wrangling rather than strategic thinking. This is where the gap between potential and performance widens.
Bridging the Gap: From Data to Decision
Mastering your KPIs requires a strategic framework that goes beyond simple reporting. It’s about creating a living, breathing performance ecosystem within your organization. This involves several critical shifts in mindset and process:
- Contextualize Your Metrics: A standalone KPI is just a number. A 5% conversion rate is meaningless without context. Is that up from 2% last quarter? Is the industry benchmark 7%? Is it driven by a single marketing channel? Activating your KPIs means always asking "why" and "so what" to connect the data point to the business narrative.
- Establish a Cadence of Review: KPIs should not be relics you dust off for quarterly reviews. Integrate them into daily huddles, weekly team meetings, and monthly strategic sessions. For example, a sales manager should be looking at CAC and conversion rates weekly, while a CEO might review MRR and CLV on a monthly basis. This regular cadence turns metrics into a shared language for performance.
- Democratize Access to Insights: The power of KPIs multiplies when they are understood and utilized across teams. An operations manager who understands the impact of inventory turnover on gross margin can make more informed purchasing decisions. A marketing team that sees the direct link between their campaign ROI and the company's overall profitability is better equipped to allocate its budget effectively.
Actionable Next Steps to Activate Your KPIs
Moving from theory to practice is the most crucial step. Here is a tactical roadmap to help you begin activating the key performance indicators examples discussed in this article within your own work environment.
- Conduct a KPI Audit: Start by reviewing your current dashboards and reports. Which of the ten KPIs covered here are you tracking? Which are you missing? More importantly, which ones are truly vital to your specific strategic goals for the next 6-12 months? Eliminate "vanity metrics" and focus on the indicators that directly link to revenue, profitability, and customer satisfaction.
- Assign Clear Ownership: Every key KPI needs an owner. This person is responsible not just for reporting the number but for analyzing its trends, explaining its fluctuations, and recommending actions based on the insights. For instance, the Head of Customer Success should own NPS and CLV, while the VP of Sales owns MRR and CAC.
- Automate the Technical Workload: The single biggest barrier to effective KPI management is the manual labor involved. The time spent exporting data, wrestling with complex formulas, and building charts is time not spent on strategy. This is where modern tools can create a massive efficiency lift. Instead of fighting with
VLOOKUPorSUMIFSto calculate your metrics, you can leverage technology to get instant answers.
Imagine being able to open your sales spreadsheet and simply ask, "What was our Customer Acquisition Cost per channel last quarter?" or "Chart the month-over-month trend for our MRR." This is no longer a futuristic concept. By automating the technical side of KPI analysis, you empower your team to focus on high-value strategic work, accelerating your journey from simply tracking data to mastering business performance.
Are you tired of spending hours wrestling with complex formulas just to track your team's performance? AIForExcel integrates directly into your spreadsheets, allowing you to ask complex questions in plain English and get instant, accurate answers and visualizations for your most critical KPIs. Stop Googling formulas and start driving strategy by visiting AIForExcel to automate your analysis today.