Why Manual Financial Reports Are Draining Your Team
Let's be honest, manual financial reporting is a headache. It's like building a ship with tweezers – slow, fiddly, and prone to mistakes. I've chatted with so many CFOs and finance managers who are buried under spreadsheets, wrestling with formulas, and losing evenings and weekends just to close the books. That supposed two-day monthly close? It often stretches into a two-week marathon of stress and frustration. Even something as simple as consolidating departmental budgets can become an afternoon-long saga if someone puts a decimal in the wrong place.
These aren't just minor annoyances; they have serious consequences. Manual processes bottleneck crucial business decisions. Imagine needing funding for a vital project, but your cash flow analysis is trapped in a spreadsheet limbo. The opportunity might vanish before you even get the report done. This is the real cost of manual reporting – missed opportunities, delayed insights, and the inability to react quickly to changing market conditions.
And let's not forget the impact on your team. The constant pressure to be 100% accurate in manual reports creates a stressful environment. They’re constantly double-checking their work, terrified of making a small error with big consequences. It's not just the extra hours; it's the mental fatigue of always being on high alert. It's the kind of stress that makes experienced finance professionals wish they'd made a change sooner.
The Automation Gap
The funny thing is, everyone knows automation is the answer. But there's a big gap between knowing and doing. Industry data shows a stark contrast: while 82% of CFOs increased their investments in digital technologies in 2024, 49% of finance departments still rely heavily on manual processes, operating with zero automation. Only 13% have fully automated their reporting. This huge disparity highlights the challenges companies face in adopting new technologies. For a deeper dive into these automation statistics, check out this blog post.
To illustrate the difference automation can make, take a look at this comparison:
Manual vs Automated Financial Reporting: Time and Cost Comparison A detailed breakdown showing time investment, error rates, and cost implications between manual and automated reporting approaches.
| Process | Manual Method (Hours) | Automated Method (Hours) | Error Rate | Monthly Cost Impact |
|---|---|---|---|---|
| Monthly Close | 40 | 8 | 5% | $5,000 |
| Budget Consolidation | 16 | 2 | 3% | $2,000 |
| Cash Flow Analysis | 24 | 4 | 2% | $3,000 |
| Regulatory Reporting | 32 | 6 | 7% | $4,000 |
| Management Reporting | 20 | 3 | 4% | $2,500 |
As you can see, the time savings and reduction in error rates are significant. This translates directly into cost savings and improved accuracy, freeing up your team to focus on more strategic work.
Automating your financial reporting isn't just about working faster—it's about empowering your team to do what they do best: analyzing data, providing strategic insights, and driving business growth. It's about transforming your finance department from a reactive cost center into a proactive strategic partner. It’s about building a future where your team isn't just crunching numbers, but shaping the future of your business.
Building Your Financial Automation Foundation That Actually Works
Successfully automating your financial reporting isn't about diving headfirst into complex formulas. It's more about building a solid, reliable foundation. I've seen this myself – a well-planned setup makes all the difference. It's the difference between a smooth, efficient system and one that constantly needs fixing.
Auditing Your Excel Workbooks
First, really dig into your current Excel workbooks. What reports take up the most time? Which ones are error-prone? Don’t try to automate everything at once. Instead, focus on the biggest headaches, the reports that offer the most potential for saving you time and effort.
Organizing Data and Naming Conventions
Once you've identified your targets, set up clear rules for how your data is organized. This is where a lot of automation projects go wrong. Inconsistent data, confusing file names, and data scattered everywhere are the enemies of automation. Setting up standardized naming conventions might feel tedious now, but it will save you so much frustration later. Think of it like organizing a pantry – you'll know exactly where everything is when you need it.
Establishing Stable Data Connections and Templates
Next, consider your data connections. How's your data getting into Excel? Manual copy-pasting? Unstable links that break when files are moved? Set up strong data connections that can handle the inevitable file shuffling. Creating reusable templates for your team is also essential. These templates are like building blocks for your automated reports, ensuring consistency and reducing errors. Here's a typical Excel interface:  Notice the familiar layout – the ribbons, the formula bar, and the cells. This is where the automation magic happens, and having organized data is key.
Prioritizing Automation Efforts
Finally, be realistic. Not everything needs to be automated right away. Focus on the tasks that give you the biggest bang for your buck – the ones that save the most time and reduce the most errors. Start with the easy wins. This builds momentum and shows your team the real value of automation. This is especially important with the growth we’re seeing in the financial automation market. It's projected to reach $18.4 billion by 2030, growing at a 14.6% CAGR from 2024, all because businesses need efficient, data-driven decisions. Learn more about financial automation market growth here. Building a strong foundation now creates a system that can grow and adapt. This initial work may not be glamorous, but it's the essential first step to truly powerful automated financial reporting. It’s like building a house on solid rock, not sand.
Transforming Your Essential Financial Reports Into Automated Powerhouses
Let's be honest, manually creating financial reports eats up a ton of time. Think about those monthly income statements, cash flow analyses, and dreaded budget variance reports. I've been there, and trust me, automating these key reports can completely change the game. I’ve seen how finance teams have turned these time-consuming tasks into smooth, self-updating systems, and I'm here to share how they did it.
Choosing the Right Excel Functions
Picking the right Excel functions is like selecting the right tools for a job – it makes all the difference. For income statements, SUMIFS and INDEX/MATCH are your go-to functions. They're perfect for grabbing data based on specific criteria, like department or account code. When dealing with cash flow, OFFSET or INDIRECT can dynamically reference different periods, making your reports more adaptable. And for variance analysis, don't forget those dollar signs for absolute referencing! This ensures your formulas stay accurate when you copy them across cells.
Imagine you're building a cash flow projection. Using OFFSET allows you to easily shift the time period you're analyzing, so you can quickly compare Q1 vs. Q2 without rewriting all your formulas. These small tweaks can save hours each month.
Handling Multiple Data Sources
In the real world, your data often lives in different places. Sales might be in a CRM, expenses in an ERP, and your budget… well, maybe that's still in another spreadsheet. The trick is to import all this data into Excel efficiently and automatically. Power Query is your secret weapon here. It's like a data vacuum that pulls information from various sources and cleans it up, ready for your reports.
I once worked with a company whose sales data lived in Salesforce. Manually exporting and cleaning it every month took days. With Power Query, they automated the entire process, reducing the time to just a few minutes.
Automating Report Formatting
Nobody wants to spend hours formatting a report after it’s already generated. That’s where conditional formatting comes in. Set up rules to automatically highlight key figures, flag significant variances, or even change cell colors based on performance. This not only saves time, but it also makes your reports visually engaging and much easier to understand.
Think about highlighting variances over 10% in red. This instantly draws attention to potential issues, saving you time from manually scanning the report.
To help illustrate the impact of automation, take a look at this infographic:
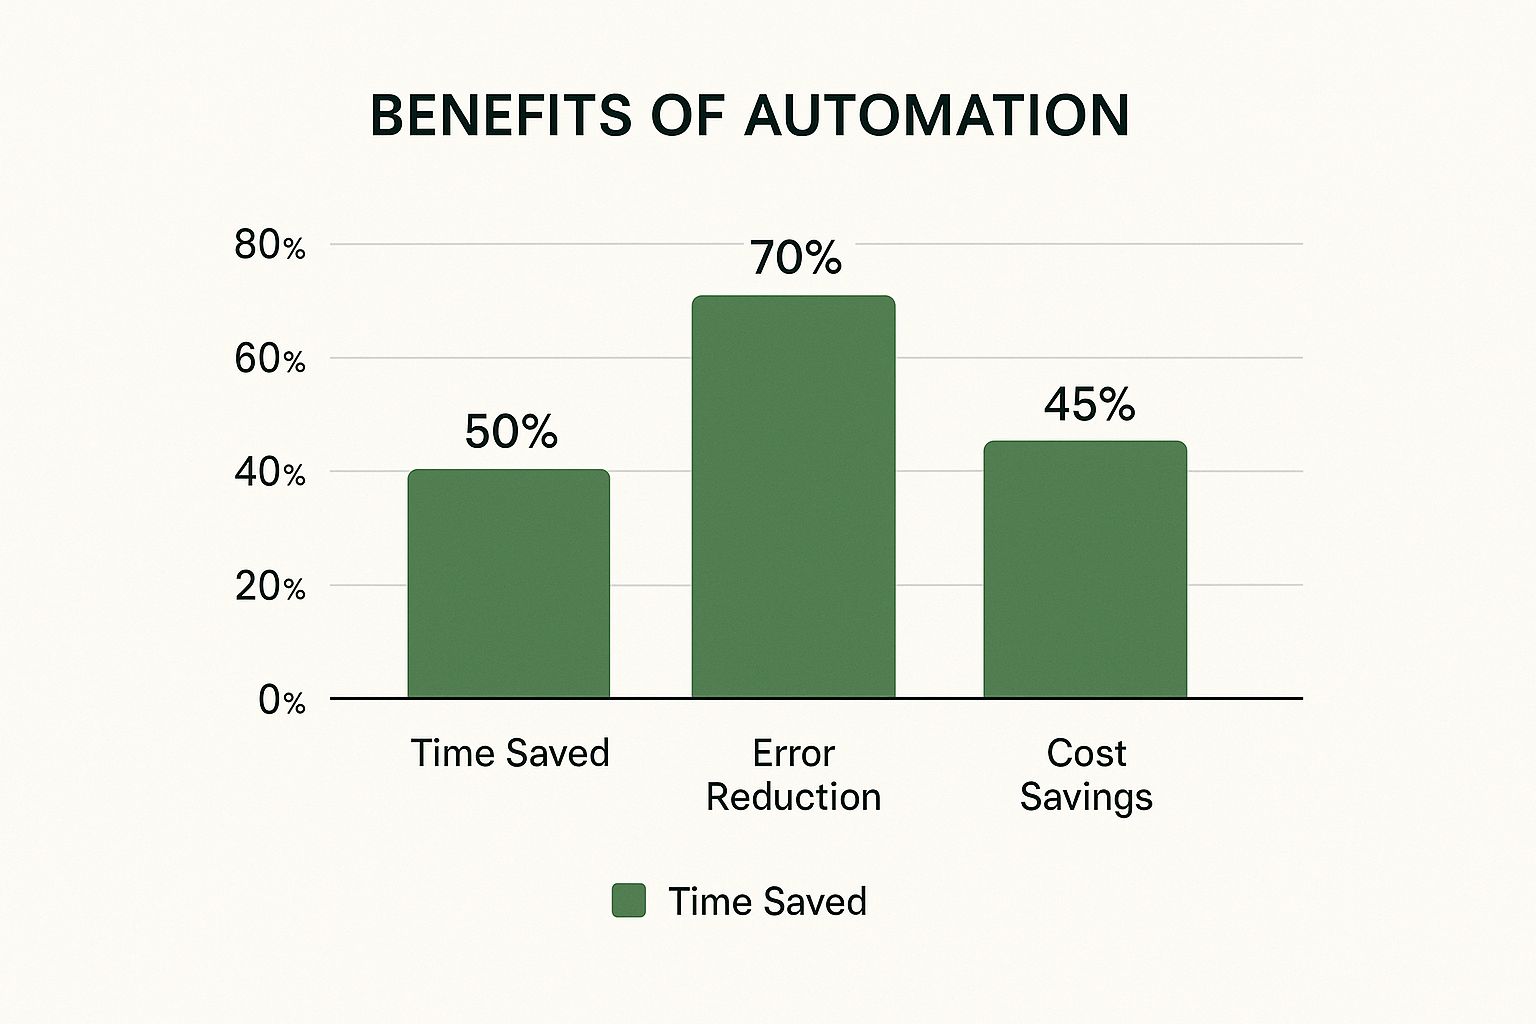
As you can see, automation can lead to a 50% reduction in time spent, a 70% decrease in errors, and a 45% saving in costs. These aren't just made-up numbers; I've seen these results firsthand.
Addressing Practical Challenges
Automation isn’t always a walk in the park. You might encounter missing data, different fiscal periods, or new account codes popping up unexpectedly. For missing data, IFERROR can display a blank cell or a message like "Data Not Available," preventing errors in your calculations. To manage fiscal periods, use dropdown menus so users can easily select the period they want to view. And for those pesky new account codes? Design your reports with flexibility in mind, using dynamic ranges and named ranges that automatically adjust as your data changes.
I recall working with a company that struggled with constantly changing account codes. By implementing dynamic ranges, they eliminated the need to manually update their reports every time a new code was added.
To give you a better idea of which reports to prioritize for automation, I’ve put together a handy matrix:
Essential Financial Reports: Automation Priority Matrix
Strategic ranking of common financial reports by automation complexity, time savings potential, and business impact
| Report Type | Complexity Level | Setup Time | Monthly Time Saved | Business Impact | Priority Score |
|---|---|---|---|---|---|
| Income Statement | Low | 4 hours | 8 hours | High | 9 |
| Balance Sheet | Low | 2 hours | 4 hours | High | 8 |
| Cash Flow Statement | Medium | 8 hours | 12 hours | High | 7 |
| Budget vs. Actuals | Medium | 6 hours | 10 hours | Medium | 6 |
| Sales Report | Low | 2 hours | 2 hours | Medium | 5 |
This matrix offers a quick overview of where to focus your automation efforts, prioritizing reports with high impact and relatively low complexity.
It's also worth noting that automation is making waves in other areas of finance, like accounts payable. Did you know 52% of AP professionals now spend less than ten hours a week processing invoices, down from 62% previously? This shift is largely due to automation tools that free up finance teams for more strategic work. For more on AP automation trends, check out this report: here.
Troubleshooting and Testing
Even the best-laid plans can go awry. That's why testing is so important. Before launching your automated reports, test them thoroughly with different data sets and scenarios. Excel's built-in auditing tools, like Evaluate Formula, can help pinpoint errors in complex calculations. And always have a backup plan! If one data source fails, you need a contingency.
If you're ready to explore the world of AI-powered Excel for financial reporting, take a look at this comprehensive guide: Learn more about financial reporting with AI in Excel. By mastering these techniques and anticipating potential challenges, you can transform your essential financial reports into powerful, automated systems that work for you, freeing up your team to focus on what really matters: driving business growth.
Advanced Automation Techniques That Finance Pros Actually Use

We've talked about automating your basic financial reports. Now, let's explore how to really amp things up with automation. This is where you'll unlock significant time savings and gain much richer insights.
Dynamic Dashboards and Conditional Formatting
Think of dashboards that refresh themselves the moment new data hits your system. No more manual updates, no more outdated figures. That's the magic of dynamic dashboards. Combine this with conditional formatting, and your system not only displays the numbers but also highlights key trends and potential issues.
For instance, you can configure conditional formatting to flag any budget variances over 10%, instantly spotlighting areas that need a closer look. This proactive approach helps you address problems before they escalate.
Imagine this: you're reviewing your monthly performance, and suddenly, a few cells light up in red. Boom! You've instantly identified a budget overrun in marketing before it impacts your bottom line.
Integrating with Your Business Systems
Let's be real, financial data lives everywhere – your ERP system, your CRM, and probably a few other places too. Manually importing this data into Excel is a recipe for disaster and wasted hours.
This is where integrations come in. Picture Power Query automatically feeding data from your ERP and CRM directly into your Excel reports. This eliminates tedious manual entry and ensures you're always working with the latest information. This real-time view can transform your reporting from a static snapshot into a dynamic pulse on your business.
Automated Alerts and Rolling Forecasts
Ever wished for a system that alerts you when something goes off track? That's precisely what automated variance alerts can do. They notify key people when actuals significantly deviate from the budget, allowing for quick adjustments.
Pair this with rolling forecasts that automatically update based on actual performance, and you have a truly proactive financial planning system. I saw this in action at a retail company, and it dramatically improved their responsiveness to market changes. They went from reacting to problems after they occurred to proactively adapting their strategy in real-time.
Advanced Excel Features for Custom Solutions
Excel boasts some powerful, often overlooked features that can supercharge your automation. Power Query, as mentioned, is a game-changer for data transformation. Automated pivot tables can generate complex reports in a few clicks.
For truly unique reporting needs, creating custom functions in Excel can provide tailored solutions. I once built a custom function for a client that automated their revenue recognition calculations based on their complex contract terms. It saved them hours every month and eliminated manual calculation errors. For more resources, check out our guide on free data analysis tools.
Troubleshooting and Building Redundancy
Even automated systems can have hiccups. That's why knowing how to troubleshoot complex formulas is crucial. Excel's "Evaluate Formula" feature is incredibly helpful for tracking down errors.
Building redundancy into your system is equally important. Having backup data sources or secondary calculations ensures your reporting continues uninterrupted, even if one part of the system fails. This proactive approach minimizes disruptions and ensures business continuity.
Building reliable and robust automated systems doesn't just save time; it empowers your team to focus on higher-value activities like analyzing trends, extracting insights, and contributing to strategic decisions.
Creating Reports That Drive Better Business Decisions

Automating your financial reporting is fantastic, but it’s all for nothing if the reports don’t actually help anyone make decisions. I've seen it myself – beautifully formatted reports left to gather dust because they just don’t connect with the people who need them. So let’s explore how to make your automated reports not just attractive, but truly effective tools for driving action.
Identifying Key Metrics for Different Stakeholders
When it comes to financial data, there's no one-size-fits-all solution. A CEO needs a high-level view, while a department head craves granular detail. Consider your audience. What metrics truly matter to them? For your board, focus on big-picture trends like revenue growth and profitability. For department heads, dig into operational metrics like sales conversion rates or cost per acquisition.
For example, when presenting to the sales team, focus on metrics like sales growth, conversion rates, and average deal size. These are the numbers that directly affect their day-to-day work and inspire improvement.
Adding Meaningful Context to Your Numbers
Numbers without context are just…well, numbers. They don't tell a story. Instead of simply presenting a sales figure of $1 million, explain what it means. Is it a 10% increase year-over-year? Is it above or below target? Adding context brings the data to life and makes it relevant.
Think about showing a graph of website traffic. Simply displaying a traffic increase is good, but explaining that it's a result of a successful marketing campaign adds invaluable context and showcases your team's hard work.
Crafting Executive Summaries That Get Read
Busy executives don’t have time to wade through pages of data. A concise, insightful executive summary is essential. It should highlight the key takeaways and recommendations, allowing leaders to grasp the report's essence in minutes. It’s like an elevator pitch for your data.
A well-crafted executive summary can make the difference between a report that influences decisions and one that’s ignored. It’s often the first (and sometimes only) thing your audience will read, so make it count.
Building Interactive Reports for Deeper Exploration
Executive summaries provide the overview, but interactive elements let users dive deeper. Imagine a chart where clicking a data point reveals underlying details, or a dropdown menu that filters data by region or product line. This puts the power of exploration in the users’ hands.
It's like a choose-your-own-adventure for your data! Users can follow their curiosity and explore the areas that interest them most.
Visualizing Trends and Outliers
Charts and graphs are fantastic for highlighting trends and outliers. A simple line chart can show revenue growth over time, while a scatter plot can reveal correlations between variables. Choose visualizations that clearly tell your data's story.
Rather than burying key trends in a table, use an engaging chart to highlight them. This makes it easier for your audience to understand the main points and their impact.
Incorporating Commentary and Explaining "So What?"
Data visualization is crucial, but don't forget to add your own commentary. Explain what the numbers mean for the business. What actions should be taken based on these insights? Answering the "so what?" question turns data into action.
For example, if you're showing declining sales in a specific region, offer potential explanations and suggest solutions. This transforms your report from passive observation to a proactive tool for improvement.
By following these principles, your automated financial reports become dynamic tools that drive better decisions. It's about empowering your organization to use data effectively, to understand not just what happened, but why it happened and what to do about it. It's about creating reports that tell compelling stories, spark conversations, and ultimately shape your business's future.
Avoiding Automation Pitfalls That Derail Most Projects
Let's be real, automation can sometimes backfire and create more work. I've chatted with plenty of finance folks who've seen amazing automation wins, and some spectacular crashes. Here's what I've learned about what can go wrong.
Over-Engineering Simple Solutions
It's easy to get carried away with the power of automation and build something crazy complex. The truth is, sometimes a simple formula or macro in Microsoft Excel does the trick. Super complex systems are a nightmare to maintain, troubleshoot, and they break more often.
I once saw a team spend weeks building this elaborate automated reporting system. Turns out, they could've done the whole thing with a few pivot tables and some smart conditional formatting. Keep it simple!
Ignoring Data Quality Issues
Think of your automated system like a car. Even a Ferrari won't run on bad gas. Same goes for automation. Garbage in, garbage out. Before automating anything, clean up your data. Clean, consistent data is key for accurate and reliable reports. Check out this guide on data cleaning techniques. It's a lifesaver.
Handling Resistance to Change
People can be hesitant about new tech, especially if they're comfortable with the old way. Clear communication is key. Explain the benefits of automation. Show them how it can free up their time for more interesting projects. Make it about them, not just the company.
Increased Workload From Poorly Designed Automation
Sometimes, automation creates more work. This often happens when the new system doesn't fit in with existing workflows, or creates new bottlenecks. I worked with a company where their automated reporting system generated so many alerts, the team spent all their time managing those instead of analyzing the data! Design automation that streamlines, not complicates.
Maintaining Automated Systems Over Time
Things change. Departments are added, codes change, reporting requirements shift. Your systems need to adapt. Build flexibility in from the beginning. Use dynamic ranges and named ranges in Excel. Regularly review and update your processes.
Training Your Team Effectively
Automation isn't a set-it-and-forget-it deal. Your team needs to know how the system works, how to fix small issues, and how to maintain it. Invest in good training and documentation. Create easy-to-understand guides. This empowers your team and ensures long-term success.
Your Roadmap To Financial Reporting Excellence
So, we've covered the basics of automating financial reporting. Now, let’s talk strategy. Building a solid, realistic implementation plan is essential. Think of it like planning a cross-country road trip: you need a destination, the best route to get there, and a plan for handling unexpected detours. This section will help you create a personalized approach that works for your organization, no matter its size or technical expertise.
Securing Buy-In and Setting Realistic Timelines
First things first: get everyone on the same page. It’s crucial to convince leadership and your team that automation is worth the time and effort. Highlight the advantages: faster reporting, fewer errors, and – my favorite – more time for actual strategic analysis. Emphasize that this isn't about replacing people, but empowering them with better tools. And speaking of tools, learning new tools takes time, as does adjusting to new processes. There will be bumps in the road. Factor that into your plan from the beginning. Trust me on this one.
I once worked with a team that seriously underestimated the training time needed for a new system. The project fell behind schedule, and everyone got frustrated. That experience taught me a valuable lesson: always build in buffer time for the unexpected.
Measuring Success and Demonstrating Value
How will you know if your automation efforts are paying off? You need to define clear metrics right from the start. Track the time saved, the reduction in errors, and even improvements in team morale. Putting numbers to your success clearly demonstrates the value of automation and helps justify future investment in the process.
For example, track how long it takes to generate a particular report before and after automation. This kind of concrete data is incredibly powerful when you're showcasing your progress.
Continuous Improvement and Scaling Your Capabilities
Automating your financial reporting isn’t a one-and-done project; it’s an ongoing process. As your team gets comfortable with the new systems and processes, explore more advanced techniques. Gradually scale your automation capabilities, tackling more complex reports and integrations as you go.
Start small, maybe with automating a simple income statement. Then, gradually work your way up to a dynamic dashboard that pulls data from multiple sources. This kind of gradual progression keeps your team engaged and prevents them from feeling overwhelmed.
Developing Internal Expertise and Reducing External Reliance
Building internal expertise is like having your own dedicated pit crew. It reduces your dependence on outside consultants, which saves money and gives you greater control. Encourage your team to become in-house automation experts. Provide training and resources, and create opportunities for them to share their knowledge with each other.
I've seen firsthand how companies have completely transformed their finance departments by investing in their employees' automation skills. It fosters a culture of innovation and empowers the entire team.
Celebrating Wins and Maintaining Momentum
Last but definitely not least, don’t forget to celebrate! Acknowledging successes, both big and small, keeps your team motivated and reinforces the value of what you’re doing. It reminds everyone why they're putting in the effort.
Even something as simple as a team lunch to celebrate a successful automation implementation can significantly boost morale and maintain organizational support. This keeps the momentum going so you can continue improving your financial reporting processes and free up your team to focus on strategic analysis, not tedious data entry.
Ready to give your Excel spreadsheets an AI boost? Check out AIForExcel today and transform your financial reporting: AIForExcel - Automate Your Spreadsheets