Unlocking Insights: Your Guide to Powerful Free Data Analysis Tools
Need to analyze data but don't want to pay for expensive software? This list of ten free data analysis tools provides powerful alternatives for everything from simple spreadsheet tasks to complex statistical modeling. Learn how these tools—including AIForExcel, R, Python, and more—can help you unlock valuable insights from your data, improve decision-making, and boost productivity. Stop wasting time wrestling with spreadsheets and start generating meaningful results.
1. AIForExcel
AIForExcel is a powerful AI-driven tool that transforms how users interact with Microsoft Excel. By enabling users to articulate their spreadsheet needs in plain English, AIForExcel eliminates the need to memorize complex formulas like VLOOKUP, INDEX(MATCH), or SUMIFS. Whether your goal is to create comprehensive sales dashboards, perform intricate data analysis, or build robust financial models, you can simply type your request in natural language, and AIForExcel will instantly generate error-free, perfectly formatted Excel formulas tailored to your specific needs. This tool significantly reduces errors that can cost businesses thousands of dollars annually and compresses the time spent on spreadsheet tasks from hours to mere minutes, effectively democratizing advanced Excel capabilities for professionals of all skill levels. Learn more about AIForExcel
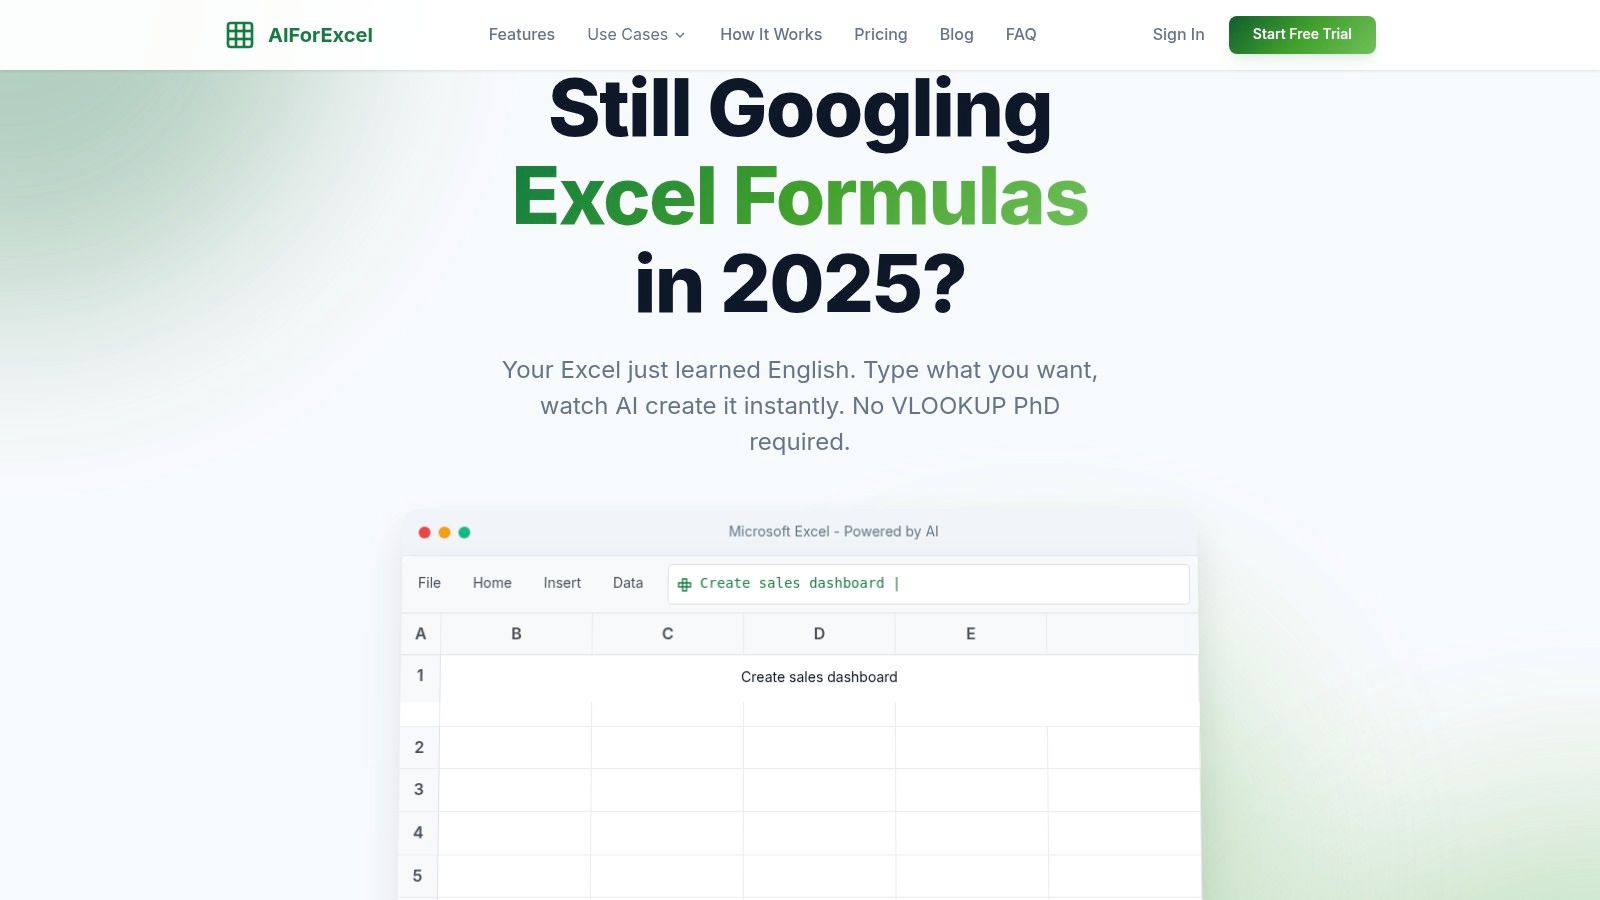
Imagine needing to calculate the total sales for a specific product category across multiple regions. Instead of wrestling with nested IF statements and SUMIFS, you can simply type into AIForExcel, "Calculate the total sales of product category 'X' in regions 'A', 'B', and 'C'." The tool instantly generates the precise formula, eliminating the risk of formula errors and saving you valuable time. This ease of use makes AIForExcel an invaluable asset for anyone working with data in Excel, from creating pivot tables and charts to performing statistical analysis.
AIForExcel seamlessly integrates into existing Excel workflows without requiring users to learn a new interface, which is a significant advantage over other data analysis tools that often necessitate extensive training and onboarding. This seamless integration minimizes disruption to established processes and allows users to quickly adopt the tool and realize immediate productivity gains. Trusted by over 4,800 managers worldwide, AIForExcel prioritizes boosting productivity and accuracy. Backed by a 30-day money-back guarantee and 24/7 support, the tool offers simple pricing plans starting at €20/month. While this cost may be a factor for individual users with light usage, the time savings and error reduction it offers represent significant value for businesses and professionals who regularly work with complex spreadsheets.
Consider a project manager tracking project budgets and timelines. AIForExcel can quickly generate formulas to calculate projected completion dates based on current progress, flag tasks that are behind schedule, and visualize budget allocation across different project phases. This empowers project managers to focus on strategic decision-making rather than getting bogged down in complex formula creation. Similarly, a marketing manager analyzing campaign ROI can use AIForExcel to effortlessly calculate conversion rates, customer acquisition costs, and other key metrics, freeing them up to focus on optimizing campaigns and maximizing impact.
While AIForExcel handles a vast majority of formula needs, it's worth noting that highly specialized or unique Excel functions may require manual adjustments. However, this is a relatively rare occurrence. The tool excels in its ability to automate the creation of common and complex formulas, empowering users to tackle a wide range of data analysis tasks with ease and efficiency.
Pros:
- Instant formula generation: Create accurate Excel formulas using natural language, eliminating the need for formula expertise.
- Significant time savings: Reduces complex reporting tasks from hours to minutes.
- Improved accuracy: Minimizes costly spreadsheet errors, ensuring data reliability.
- Accessibility: Empowers users of all skill levels to utilize advanced Excel functionalities.
- Seamless integration: Works directly within Excel without requiring a new UI or learning curve.
Cons:
- Pricing: The monthly subscription may be a consideration for individual users with light usage.
- Limitations with highly specialized functions: While rare, some highly specialized Excel functions may require manual adjustments.
For those frequently grappling with Excel's complexities, AIForExcel represents a paradigm shift in spreadsheet management. It bridges the gap between data analysis needs and technical execution, enabling anyone to unlock the full potential of Excel without the steep learning curve. Whether you are a seasoned financial analyst or a small business owner managing your own data, AIForExcel offers a compelling solution for efficient, error-free spreadsheet management. Visit the AIForExcel website to learn more about how this innovative tool can revolutionize your Excel experience.
2. R
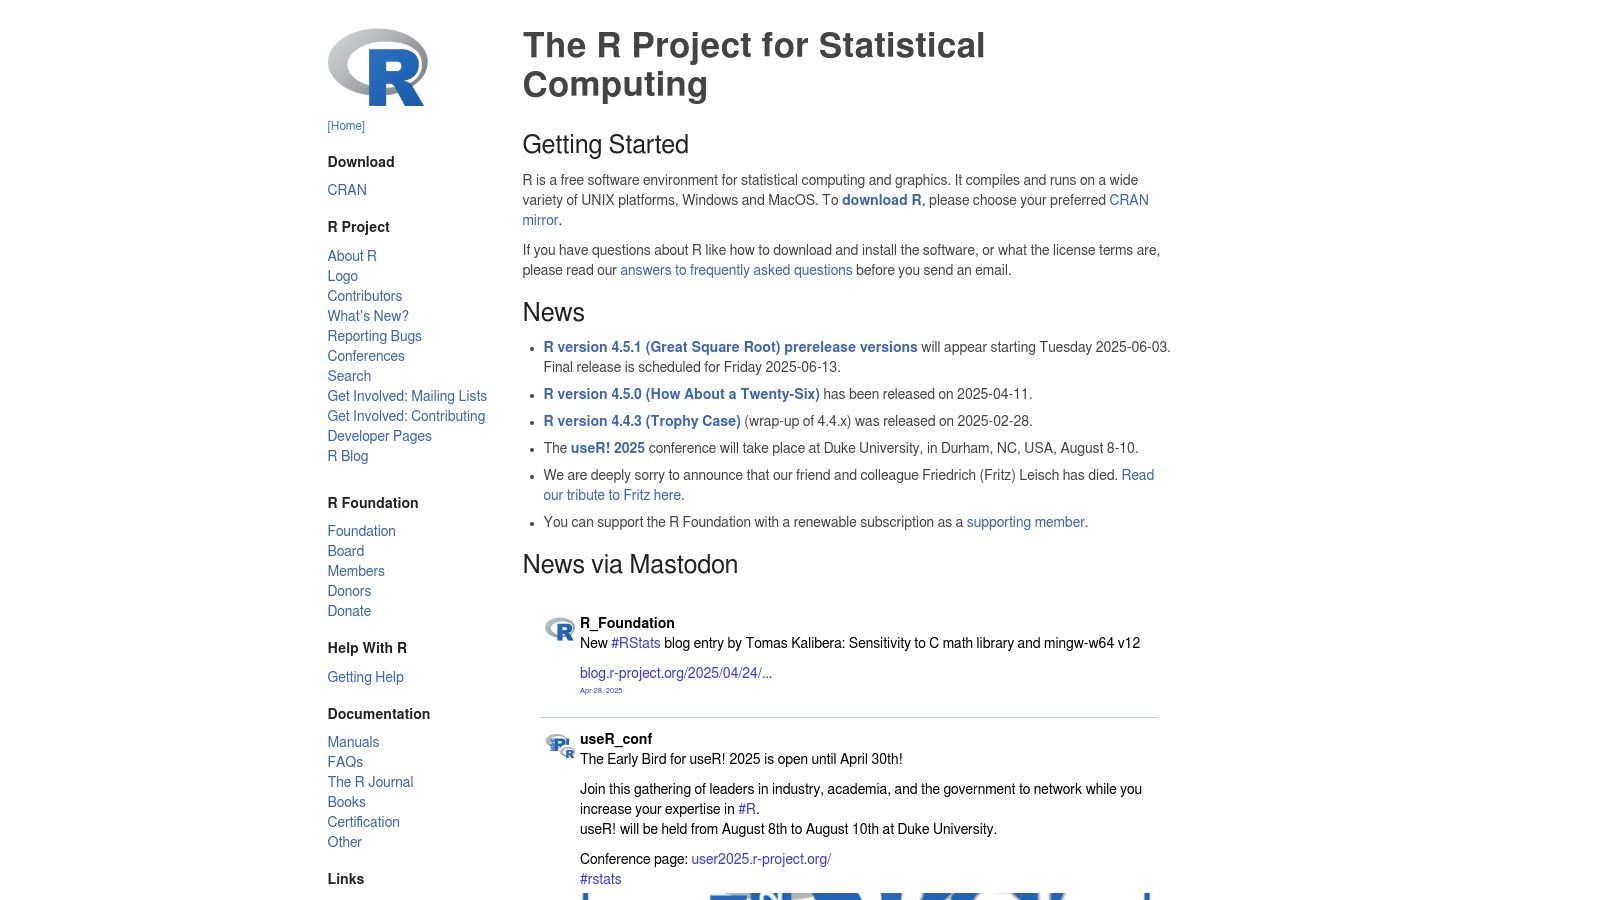
R is a powerful, free, and open-source programming language and software environment explicitly designed for statistical computing and graphics. It’s a go-to tool for data analysts, statisticians, and researchers across various fields, providing a vast array of techniques for data manipulation, analysis, and visualization. R's extensibility is a major strength, offering access to over 18,000 packages on the Comprehensive R Archive Network (CRAN). These packages cover virtually every statistical method imaginable, from basic descriptive statistics to complex machine learning algorithms, making R a truly versatile tool for free data analysis. Its robust capabilities place it among the top free data analysis tools available.
R’s comprehensive statistical analysis capabilities cover a wide range of methodologies, including linear and non-linear modeling, time series analysis, classification, clustering, and much more. For instance, marketing managers can use R to analyze campaign ROI and customer segmentation, while financial analysts can leverage its capabilities to build complex financial models and assess risk. Project managers can use R to track project timelines and resource allocation through statistical forecasting. The extensive CRAN package ecosystem further expands R's functionality. Packages like ggplot2 offer advanced data visualization options, allowing users to create publication-quality graphs and charts, which can significantly enhance reports and dashboards for mid-level managers and department heads. Other packages provide specialized tools for specific industries or research areas, such as bioinformatics, econometrics, and social sciences.
R’s open-source nature contributes to a vibrant and active community. This translates into readily available support through forums, mailing lists, and online documentation. This extensive support network is invaluable for beginners navigating the learning curve and for experienced users seeking solutions to complex problems. This makes R a great free data analysis tool for professionals at all levels, including solo entrepreneurs, freelancers, and small business owners who might not have dedicated IT support. Even executives and administrative staff can leverage R for data-driven decision-making and reporting.
Pricing and Technical Requirements: R is entirely free to use and distribute, making it an accessible option for individuals, businesses, and academic institutions. It runs on a variety of operating systems including Windows, macOS, and Linux.
Comparison with Similar Tools: While tools like Python offer similar data analysis capabilities, R stands out with its specialized focus on statistics. Its vast collection of statistical packages and the active community focused specifically on statistical computing provide an edge for users primarily dealing with statistical analysis. For instance, while Python libraries like Pandas and Scikit-learn are powerful, R’s dedicated packages often offer more specialized statistical functionalities and are generally preferred by statisticians.
Implementation and Setup Tips: Getting started with R involves downloading the base distribution from CRAN and choosing an IDE (Integrated Development Environment) such as RStudio, a popular choice that provides a user-friendly interface for writing and running R code. Beginners should focus on mastering the basics of R syntax and explore introductory tutorials focusing on data manipulation, basic statistics, and data visualization using ggplot2. As your skills develop, explore specialized packages relevant to your field and take advantage of the vast online resources and the R community. For example, MBA students and researchers can benefit from learning R for data analysis in their case studies and projects.
Pros:
- Completely free and open-source
- Massive community support and comprehensive documentation
- Unmatched capabilities for statistical analysis and research
- Highly customizable and extensible through CRAN packages
Cons:
- Steep learning curve, particularly for users unfamiliar with programming concepts.
- Can be memory-intensive when dealing with extremely large datasets.
- The command-line interface can be daunting for beginners, although IDEs like RStudio mitigate this issue.
Website: https://www.r-project.org
R's comprehensive statistical capabilities, free availability, and thriving community make it an invaluable tool for anyone working with data. While it may require an initial investment of time to learn, the rewards in terms of analytical power and flexibility make it a worthwhile free data analysis tool for both beginners and seasoned data professionals. Its ability to handle complex statistical analyses, create insightful visualizations, and adapt to specific research needs makes it a vital resource for anyone seeking to derive meaningful insights from data.
3. Python (with Pandas, NumPy, Matplotlib)
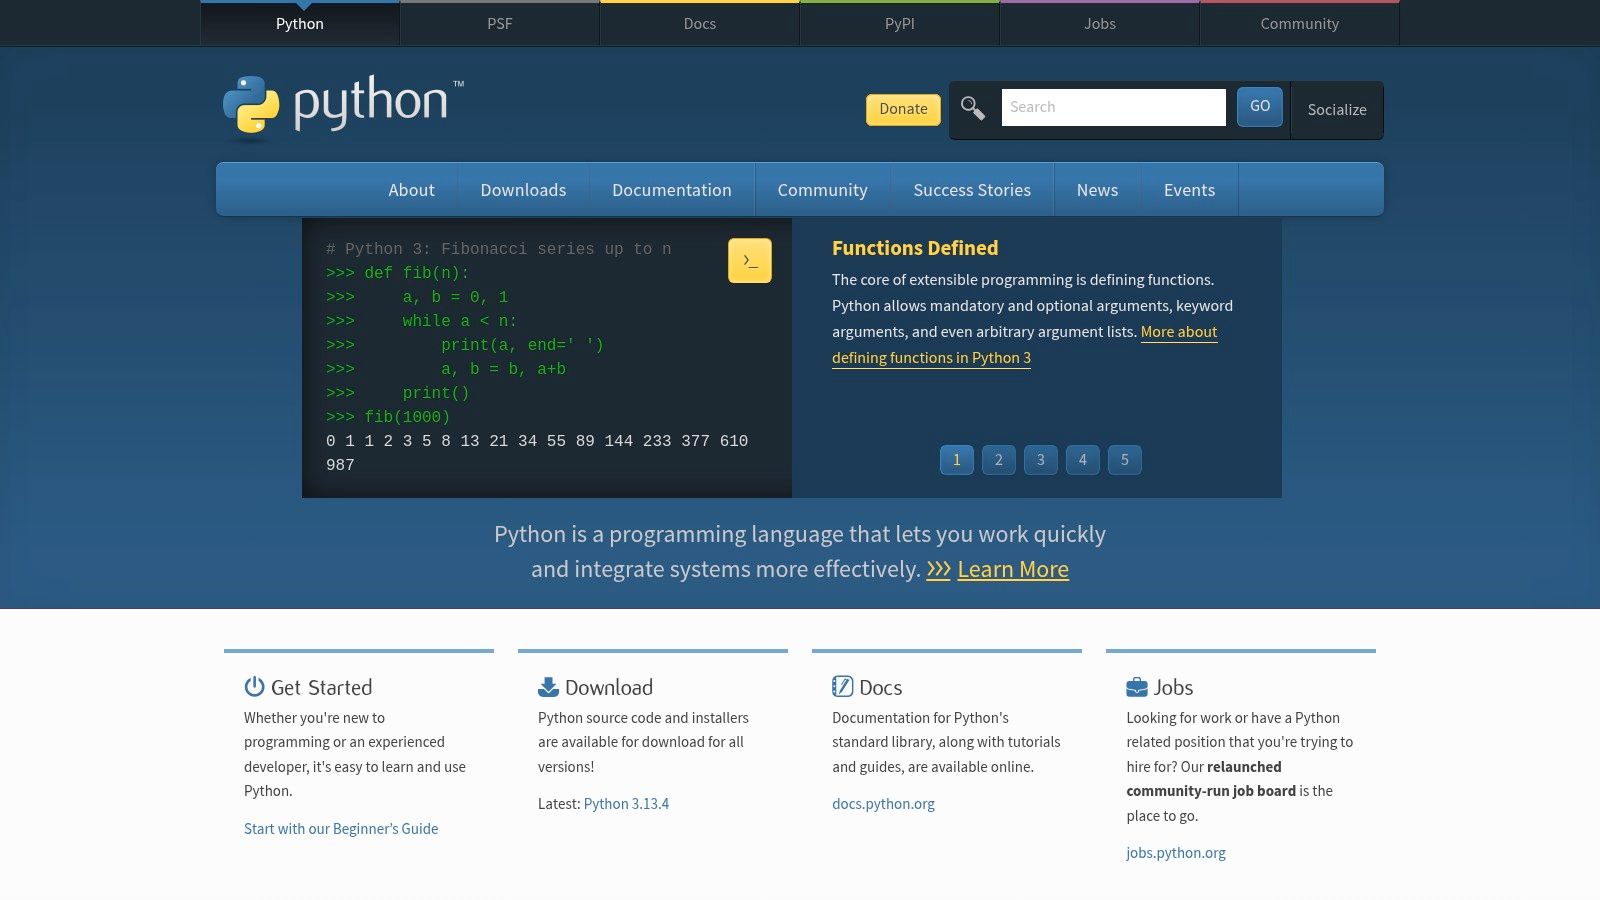
Python, a versatile and widely-used programming language, transforms into a powerhouse for data analysis when combined with its rich ecosystem of libraries. Specifically, Pandas, NumPy, and Matplotlib (often supplemented by Seaborn) provide the core tools for manipulating, processing, and visualizing data, making Python a popular choice among data scientists and machine learning engineers, but also accessible to anyone willing to learn the basics of programming. This combination allows for a flexible and comprehensive approach to data analysis, tackling everything from simple data cleaning tasks to complex statistical modeling. Its open-source nature and extensive community support further solidify Python's position as a leading free data analysis tool.
Pandas provides data structures like DataFrames, which are essentially tables with rows and columns, perfect for organizing and manipulating data. Think of it as a supercharged spreadsheet within your code. You can easily filter, sort, group, and aggregate data using intuitive commands. NumPy, on the other hand, provides the mathematical backbone, enabling efficient numerical computations and array operations, essential for statistical analysis and machine learning. Matplotlib and Seaborn step in for the visual aspect, allowing you to create compelling charts and graphs to communicate your findings effectively.
For practical applications, imagine a marketing manager analyzing campaign ROI. Python with Pandas can effortlessly import data from various sources (CSV, Excel, databases), clean and transform it, and calculate key metrics like conversion rates and customer lifetime value. Matplotlib can then visualize these metrics in clear dashboards, revealing trends and insights that drive future campaigns. Similarly, a financial analyst can leverage Python to build complex financial models, backtest investment strategies, and generate portfolio reports. Even for tasks like project management, Python can be used to analyze project timelines, track resource allocation, and forecast completion dates.
One of the key advantages of Python as a free data analysis tool is its versatility. Beyond data manipulation, visualization, and analysis, you can use Python for web development, automation, and even machine learning with libraries like Scikit-learn. This makes it a valuable skill to acquire, opening up numerous opportunities across various domains. The strong community support and extensive documentation available online make learning and troubleshooting significantly easier. Jupyter Notebook integration further enhances the interactive data analysis experience, allowing you to combine code, text, and visualizations in a single document.
While Python offers significant benefits, it’s important to acknowledge its limitations. Unlike point-and-click tools, Python requires programming knowledge. While its syntax is considered relatively beginner-friendly compared to some other languages, there is still a learning curve. Additionally, for certain computationally intensive operations, Python can be slower than compiled languages like C++ or Java. Managing package dependencies can also become complex as your projects grow.
Despite these drawbacks, Python remains a powerful and versatile free data analysis tool, suitable for a wide range of users. Its combination of powerful libraries, open-source nature, and large community support makes it an excellent choice for anyone seeking to delve deeper into data analysis, whether you're a seasoned data scientist or a business professional looking to enhance your analytical capabilities. You can download Python from https://www.python.org. Beginning with tutorials focused on Pandas, NumPy, and Matplotlib will provide a strong foundation for exploring its data analysis capabilities.
4. Apache OpenOffice Calc
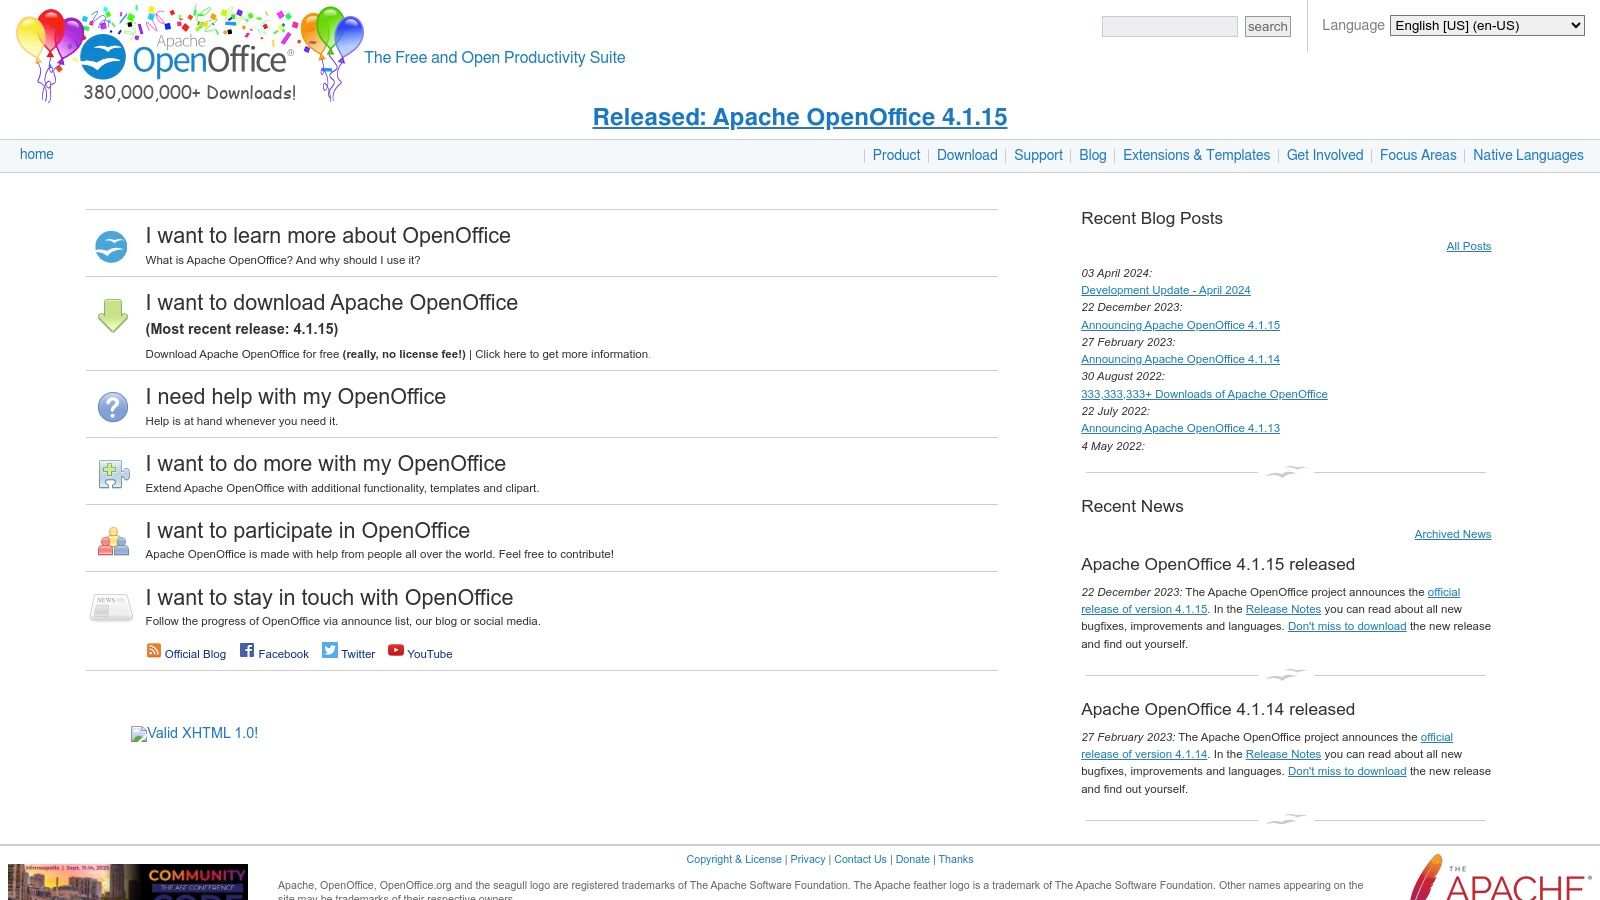
Apache OpenOffice Calc is a robust and completely free data analysis tool that deserves serious consideration, especially for those seeking a cost-effective alternative to Microsoft Excel. As part of the Apache OpenOffice suite, Calc provides a familiar spreadsheet interface and a wealth of features that cater to various data analysis needs. This makes it an ideal free data analysis tool for a wide range of users, from mid-level managers creating reports to financial analysts building complex models.
One of Calc's primary strengths lies in its ability to handle many of the same tasks as Excel, including creating pivot tables, generating charts, and using a wide range of statistical functions. This functionality makes it a powerful tool for exploring data, identifying trends, and extracting meaningful insights. For example, a marketing manager can use Calc to analyze campaign ROI and customer data, while a project manager can leverage it to track budgets, timelines, and resources effectively. Even financial analysts working with complex financial models can find value in Calc's capabilities. You can learn more about Apache OpenOffice Calc and its applications in areas like sales forecasting.
Calc's user-friendly interface is particularly beneficial for non-programmers. Its design closely resembles Excel, allowing users with prior spreadsheet experience to quickly adapt and become productive. This ease of use translates to significant time savings, particularly for professionals who need to generate reports and dashboards regularly. Imagine a department head needing to analyze team performance data; with Calc's intuitive design, they can quickly create reports without getting bogged down in complex software.
Furthermore, Apache OpenOffice Calc boasts excellent compatibility with Excel files. This feature ensures seamless data exchange between users working on different platforms and reduces the risk of formatting issues or data loss. This interoperability is crucial in collaborative environments and makes it a practical free data analysis tool for teams working with mixed software.
While Calc offers a compelling free alternative to Excel, it’s important to be aware of its limitations. Compared to specialized data analysis tools, Calc’s advanced analytics capabilities are somewhat restricted. While it can handle many common statistical functions, it may not be suitable for highly complex statistical modeling. Similarly, performance can become an issue with very large datasets. Users working with massive spreadsheets might experience slower processing speeds compared to more resource-intensive applications. Finally, while Calc offers good compatibility with Excel, it might not support some of the more advanced features found in newer versions of Excel.
Key Features and Benefits:
- Spreadsheet-based data analysis: Leverage the familiarity of a spreadsheet interface for data manipulation and analysis.
- Pivot tables and data filtering: Summarize and analyze large datasets efficiently using pivot tables and powerful filtering options.
- Built-in statistical and mathematical functions: Perform a wide range of calculations using pre-built functions, simplifying data analysis tasks.
- Chart creation and data visualization: Create compelling visuals to represent data insights and communicate findings effectively.
- Support for multiple file formats: Seamlessly import and export data in various formats, including Excel files, ensuring compatibility and collaboration.
- Completely free: Eliminate software licensing costs, making it an accessible option for individuals, small businesses, and organizations on a budget.
Pros:
- Free alternative to Microsoft Excel.
- User-friendly interface for non-programmers.
- Good compatibility with Excel files.
- No subscription fees required.
Cons:
- Limited advanced analytics compared to specialized tools.
- Slower performance with very large datasets.
- Fewer advanced features than paid alternatives.
- Limited collaboration features.
Website: https://www.openoffice.org
Technical Requirements: Apache OpenOffice Calc is available for Windows, macOS, and Linux, making it a versatile option across different operating systems. The specific system requirements are relatively modest, allowing it to run on most modern computers without issue. No special hardware or software is typically required beyond the basic operating system prerequisites.
5. KNIME Analytics Platform
KNIME Analytics Platform is a powerful, free, and open-source data analysis tool that stands out for its visual workflow approach. Instead of writing lines of code, users build data pipelines by dragging and dropping pre-built components, called "nodes," onto a canvas. This visual programming style makes KNIME accessible to a broad audience, from business analysts with limited coding experience to seasoned data scientists seeking a streamlined workflow. Whether you're a project manager tracking budgets, a marketing manager analyzing campaign ROI, or a financial analyst building complex models, KNIME offers a robust and flexible environment for tackling diverse data analysis challenges. Its inclusion in this list of free data analysis tools is warranted by its unique blend of user-friendliness, extensive functionality, and powerful integration capabilities.
One of KNIME's key strengths is its vast library of over 2000+ nodes. These nodes cover a wide spectrum of data operations, including data cleaning, transformation, statistical analysis, machine learning, and visualization. This extensive collection empowers users to perform complex analyses without needing to write a single line of code. For instance, a marketing manager could use KNIME to integrate data from various campaign sources (e.g., Google Ads, social media, email), clean and transform the data, perform customer segmentation analysis, and visualize the results in an interactive dashboard, all within a single visual workflow.
While KNIME's visual interface simplifies many tasks, its underlying architecture allows for seamless code integration. Users proficient in languages like R and Python can leverage their existing skills to extend KNIME's functionality and build custom nodes. This hybrid approach caters to both code-centric and no-code data practitioners, creating a collaborative environment where different skill sets can contribute to the analysis process. For example, a data scientist could build a custom Python script for a specific machine learning algorithm and integrate it directly into a KNIME workflow built by a business analyst.
KNIME also excels in its ability to blend data from multiple sources. Whether your data resides in spreadsheets, databases, cloud services, or other formats, KNIME provides the connectors and tools to consolidate it into a unified view. This is particularly valuable for businesses dealing with fragmented data landscapes. For example, an operations manager could use KNIME to combine inventory data from a warehouse database, sales data from a CRM system, and logistics data from a third-party provider, providing a holistic view of the supply chain.
Pros:
- No programming required for basic analysis: The drag-and-drop interface makes KNIME accessible to users without coding experience.
- Extensive library of pre-built components: The vast collection of nodes covers a broad range of data operations, simplifying complex analysis tasks.
- Strong integration capabilities: Seamless integration with R, Python, and other tools allows for advanced customization and extensibility.
- Active community and good documentation: KNIME benefits from a supportive community and comprehensive documentation, making it easier to learn and troubleshoot.
Cons:
- Can be resource-intensive: Running complex workflows with large datasets can require significant processing power and memory.
- Learning curve for complex workflows: While basic operations are straightforward, mastering advanced features and building complex workflows requires time and effort.
- Limited customization compared to coding solutions: While code integration is possible, some highly specialized tasks may be better handled with pure coding solutions.
- Some advanced features require paid extensions: While the core platform is free, certain extensions, like those for connectivity to specific enterprise databases, require a paid license.
Pricing and Technical Requirements:
KNIME Analytics Platform is free to download and use. It is available for Windows, macOS, and Linux operating systems. System requirements vary depending on the complexity of the workflows and the size of the datasets being processed, but generally, a modern computer with sufficient RAM and processing power is recommended.
Getting Started with KNIME:
The KNIME website (https://www.knime.com) provides extensive resources for getting started, including tutorials, example workflows, and community forums. Downloading and installing the platform is straightforward. New users are encouraged to explore the example workflows and tutorials to familiarize themselves with the interface and core concepts.
KNIME Analytics Platform is a valuable addition to the toolkit of any individual or organization dealing with data analysis. Its visual workflow approach, extensive functionality, and integration capabilities make it a compelling free alternative to commercial data analysis software. While there is a learning curve for more complex tasks, the wealth of resources and the supportive community make KNIME a powerful tool for democratizing data analysis.
6. Orange
Orange is a powerful yet user-friendly open-source tool designed for data visualization and analysis. Its standout feature is a visual programming interface that allows users to build data analysis workflows by dragging and dropping components, or “widgets.” This innovative approach makes it an excellent choice for both beginners looking for an intuitive entry point into data science and experienced analysts seeking a more efficient way to conduct exploratory data analysis and create compelling visualizations. It democratizes data science by making complex analyses accessible to a wider audience, regardless of their coding experience. This positions Orange as a valuable addition to the arsenal of free data analysis tools available.
Orange offers a rich set of functionalities, covering everything from data preprocessing and exploration to machine learning and model evaluation. Its visual programming interface simplifies the process of constructing complex data pipelines, making it particularly beneficial for users who may be intimidated by traditional command-line or scripting-based tools. Imagine a marketing manager wanting to understand customer churn. With Orange, they can visually connect widgets for data import, preprocessing, predictive modeling (e.g., using a decision tree), and visualization, gaining insights without writing a single line of code. Similarly, a project manager could use Orange to analyze project timelines and resource allocation, visualizing potential bottlenecks and identifying areas for optimization.
The widget-based workflow in Orange provides access to a wide range of functionalities including interactive data visualization, machine learning algorithms, and statistical analysis tools. You can create scatter plots, histograms, and heatmaps to explore data patterns, apply classification, regression, or clustering algorithms, and perform hypothesis tests to validate your findings. Orange also provides specialized add-ons for specific domains such as bioinformatics and text mining, extending its applicability even further. For example, researchers could leverage the text mining add-on to analyze customer reviews and identify key themes or sentiments.
Orange stands out among free data analysis tools due to its unique combination of intuitive visual programming and powerful analytical capabilities. While tools like R offer a broader range of statistical functions, Orange's visual approach makes it much easier for non-programmers to get started with data analysis. Compared to commercial tools like Tableau, Orange provides a free and open-source alternative with a strong emphasis on data exploration and machine learning.
Pros:
- Intuitive visual interface: The drag-and-drop interface makes it easy to build complex workflows, even for beginners.
- Strong focus on data visualization: Orange offers a variety of interactive visualizations that help users understand their data.
- Educational tool: Its visual nature makes it an excellent tool for learning data science concepts.
- Python scripting support: Experienced users can extend Orange's functionality with Python scripting for more advanced analyses.
Cons:
- Limited scalability: Orange may struggle with extremely large datasets.
- Fewer statistical functions: Compared to specialized statistical software like R, Orange has a smaller library of statistical functions.
- Smaller community: Although growing, the Orange community is smaller than that of some other data analysis tools, potentially limiting the availability of support and resources.
- Performance: Complex workflows can sometimes slow down performance.
Pricing and Technical Requirements:
Orange is completely free and open-source, available for Windows, macOS, and Linux.
Implementation Tips:
- Start with the introductory tutorials available on the Orange website (https://orangedatamining.com) to familiarize yourself with the interface and basic workflows.
- Explore the different widgets and their functionalities to understand the range of analyses possible within Orange.
- Leverage the Python scripting capabilities to extend Orange's functionality and customize your analyses.
For mid-level managers, department heads, project managers, and other professionals who need to analyze data regularly, Orange offers a compelling alternative to complex spreadsheet software or expensive commercial tools. Its visual programming interface makes data analysis accessible and efficient, empowering users to derive actionable insights from their data without requiring extensive coding skills.
7. GNU PSPP
GNU PSPP is a powerful free data analysis tool designed as a free alternative to IBM SPSS. It’s specifically geared toward statistical analysis of sampled data and boasts a comprehensive suite of statistical procedures. A key advantage is its ability to read SPSS files, making it an ideal choice for those already familiar with SPSS syntax and workflows. This makes it particularly attractive for users seeking a cost-effective solution without sacrificing functionality. Whether you're a mid-level manager creating reports, a department head analyzing team performance, a project manager tracking resources, or a financial analyst building complex models, GNU PSPP can be a valuable asset.
One of the most compelling reasons to use GNU PSPP is its cost-effectiveness. As a free and open-source software, it eliminates the significant financial investment required for commercial statistical software packages like SPSS. This makes it accessible to individuals, small businesses, non-profits, and educational institutions who might otherwise struggle to afford such tools. For solo entrepreneurs, freelancers, and small business owners operating on tight budgets, this can be a game-changer. It levels the playing field, allowing them to perform robust data analysis without the hefty price tag.
GNU PSPP's comprehensive feature set rivals that of commercial alternatives. It offers a range of statistical procedures including descriptive statistics, t-tests, ANOVA, regression analysis, and hypothesis testing. These tools are crucial for a variety of applications, from analyzing marketing campaign ROI to tracking employee performance metrics. For instance, a marketing manager could use GNU PSPP to analyze customer data and determine the effectiveness of different marketing channels. Similarly, an HR professional could leverage it to track employee performance and identify areas for improvement.
The software offers both graphical user interface (GUI) and command-line interfaces, catering to users with varying technical proficiencies. The GUI provides a more intuitive experience for those new to statistical analysis, while the command-line interface allows for more advanced scripting and automation. This dual approach offers flexibility and caters to both beginners and experienced users. For example, a business student learning data analysis might find the GUI easier to navigate, while a seasoned data analyst might prefer the command-line for complex tasks.
Furthermore, GNU PSPP's cross-platform compatibility ensures that it can be used seamlessly across different operating systems, including Windows, macOS, and Linux. This eliminates compatibility issues and allows for greater flexibility in choosing the platform that best suits the user's needs.
While GNU PSPP offers a compelling set of features, it's important to acknowledge its limitations. Compared to commercial alternatives like SPSS, its interface might appear less polished. The user community is also smaller, resulting in fewer readily available resources and online support. The documentation for some specific features can also be sparse, which can pose challenges for users tackling complex analyses. Additionally, GNU PSPP might not offer the same breadth of advanced analytics capabilities found in some commercial packages. For instance, certain specialized statistical procedures or advanced data visualization options might be limited.
However, despite these drawbacks, GNU PSPP remains a strong contender among free data analysis tools. Its comprehensive statistical procedures, SPSS file compatibility, and cost-effectiveness make it a valuable resource for a wide range of users, from students and researchers to business professionals and entrepreneurs. If you're looking for a powerful, free alternative to SPSS and are comfortable navigating a slightly less polished interface, GNU PSPP is definitely worth considering. You can download the software and explore its features by visiting the official website: https://www.gnu.org/software/pspp.
8. Jupyter Notebook
Jupyter Notebook is a powerful, free data analysis tool that empowers users to create and share documents containing live code, equations, visualizations, and narrative text. It's a versatile platform particularly well-suited for exploratory data analysis, prototyping, and creating reproducible research, owing to its interactive environment and support for numerous programming languages, most notably Python. Its flexibility and rich feature set make it an invaluable asset for a wide range of professionals, from financial analysts building complex models to marketing managers analyzing campaign ROI. Jupyter Notebook democratizes data analysis, making it accessible to individuals and organizations of all sizes, even without dedicated IT support. This accessibility combined with its robust functionality secures its place as a top-tier free data analysis tool.
Jupyter Notebook distinguishes itself from other free data analysis tools through its unique blend of code, visualizations, and narrative. Imagine a project manager tracking budget and timeline data. Within a single Jupyter Notebook, they can import data, clean and transform it using Python code, generate interactive charts visualizing project progress, and embed explanatory text all in one cohesive document. This eliminates the need to switch between different applications, streamlining the entire analysis process. Similarly, a marketing manager can use a Jupyter Notebook to analyze campaign performance, visualizing click-through rates and conversion metrics alongside code and interpretations, creating a comprehensive report readily shareable with the team.
One of the key strengths of Jupyter Notebook lies in its support for multiple programming languages, catering to users with diverse skill sets. While Python is predominantly used for data analysis within Jupyter, support for R, Scala, and other languages broadens its applicability across different domains. This multilingual support makes it a versatile tool for various data science tasks, including statistical modeling, machine learning, and data visualization.
Features and Benefits:
- Interactive Computing: Execute code in real-time and see results immediately, fostering an exploratory and iterative approach to data analysis.
- Multilingual Support: Leverage the strengths of different programming languages like Python, R, and Scala within the same environment.
- Rich Documentation: Combine code with markdown and rich text, enabling clear explanations and context within the analysis.
- Inline Visualizations: Create interactive charts and graphs directly within the notebook, enhancing data understanding and presentation.
- Collaboration and Sharing: Easily share notebooks with colleagues and collaborators, fostering transparency and reproducibility.
Pros:
- Excellent for Exploratory Data Analysis: The interactive nature of Jupyter Notebooks allows for rapid prototyping and experimentation.
- Reproducible Research: Capture the entire analysis process, from data cleaning to visualization, in a single shareable document.
- Strong Integration with Data Science Libraries: Seamlessly integrates with popular Python libraries like Pandas, NumPy, and Scikit-learn.
- Free and Widely Used: Accessible to everyone and enjoys a large, active community providing ample support and resources.
Cons:
- Requires Programming Knowledge: While intuitive, effective use requires some familiarity with programming concepts.
- Version Control Challenges: Managing different versions of notebooks can be complex without proper tools.
- Not Ideal for Production-Level Applications: Better suited for prototyping and analysis than for deploying production systems.
- Organization Crucial: Complex notebooks can become difficult to navigate without careful planning and structuring.
Implementation and Setup:
Installing Jupyter Notebook is generally straightforward. The recommended approach is to install it through the Anaconda distribution, which bundles Jupyter with essential Python libraries for data science. Alternatively, it can be installed using pip, the Python package installer. Once installed, launching Jupyter opens a web interface in your browser where you can create and manage notebooks.
Comparison with Similar Tools:
While tools like Google Colab offer similar functionalities, Jupyter provides more control over the environment and allows for local execution. RStudio, primarily focused on R, caters to a different user base, whereas Jupyter's multilingual support makes it more versatile.
Website: https://jupyter.org
Jupyter Notebook provides an invaluable free resource for individuals and organizations looking to delve deeper into their data. Whether you're a seasoned data scientist or just beginning your data analysis journey, Jupyter's blend of interactivity, versatility, and open-source nature makes it an indispensable tool in the modern data-driven world. For anyone seeking a powerful and free data analysis tool, Jupyter Notebook deserves serious consideration.
9. RStudio (Community Edition)
RStudio (Community Edition) is a free and powerful integrated development environment (IDE) specifically designed for the R programming language. It provides a user-friendly interface that simplifies data analysis, visualization, and statistical computing, making R more accessible to both beginners and experienced users. Its comprehensive suite of tools empowers users to efficiently write, execute, and debug R code, making it a valuable asset for various data analysis tasks. This makes it an ideal choice for free data analysis tools, especially for those looking to leverage the statistical power of R. Whether you're building complex statistical models, creating interactive visualizations, or simply exploring a dataset, RStudio offers a streamlined and efficient workflow. It's a particularly valuable tool for anyone working with data regularly, including managers, analysts, and researchers across diverse fields.
RStudio streamlines the R programming experience with features such as syntax highlighting, which visually distinguishes different code elements for improved readability, and code completion, which suggests possible code completions as you type, reducing errors and speeding up development. Built-in plotting and visualization tools allow for the creation of a wide range of static and dynamic graphics, facilitating data exploration and communication of insights. Furthermore, its robust package management system simplifies the installation and management of external R packages, extending the functionality of RStudio for specialized tasks. Integration with version control systems like Git enables collaborative development and efficient tracking of code changes.
For project managers tracking budgets, timelines, and resources, RStudio offers a powerful platform for analyzing project data, identifying trends, and creating insightful reports. Operations managers can leverage RStudio to optimize inventory levels, improve scheduling efficiency, and gain deeper insights into logistics data. Financial analysts can build sophisticated financial models, conduct risk assessments, and generate comprehensive reports using RStudio's statistical capabilities. Marketing managers can analyze campaign ROI, segment customer data, and visualize campaign performance using the platform's visualization tools. Even individuals with basic Excel skills, who find themselves spending hours each week wrestling with spreadsheets, can leverage RStudio to automate repetitive tasks, improve accuracy, and gain a deeper understanding of their data. RStudio offers a powerful alternative, allowing users to achieve professional results without needing to master complex spreadsheet formulas.
Key features and benefits of RStudio (Community Edition) include:
- User-Friendly Interface: RStudio simplifies R programming, making it accessible to users with varying levels of experience.
- Debugging and Development Tools: Robust debugging tools help identify and fix errors efficiently, while development tools streamline the coding process.
- R Ecosystem Integration: Seamlessly integrates with the vast R ecosystem, allowing users to leverage thousands of packages for specialized tasks.
- Active Community and Updates: Benefits from a large and active community providing support and contributing to ongoing development, ensuring regular updates and improvements.
Pros:
- Significantly enhances user-friendliness of R programming.
- Provides excellent debugging and development tools.
- Strong integration with the broader R ecosystem.
- Active community support and regular updates.
Cons:
- Requires some familiarity with the R programming language.
- Primarily focused on R, with limited support for other languages.
- Can be resource-intensive, especially for large datasets.
- Advanced features are available only in the paid RStudio Desktop Pro version.
Website: https://www.rstudio.com
RStudio (Community Edition) is a valuable free data analysis tool for anyone working with data in R. It bridges the gap between the power of R and the need for an accessible interface, empowering users to perform complex analyses, create insightful visualizations, and generate professional reports. While it requires some knowledge of R, the benefits in terms of efficiency, flexibility, and access to a vast statistical ecosystem make it a worthwhile investment for anyone serious about data analysis. It's an excellent free alternative to commercial statistical software, especially for individuals, small businesses, and organizations operating on a budget.
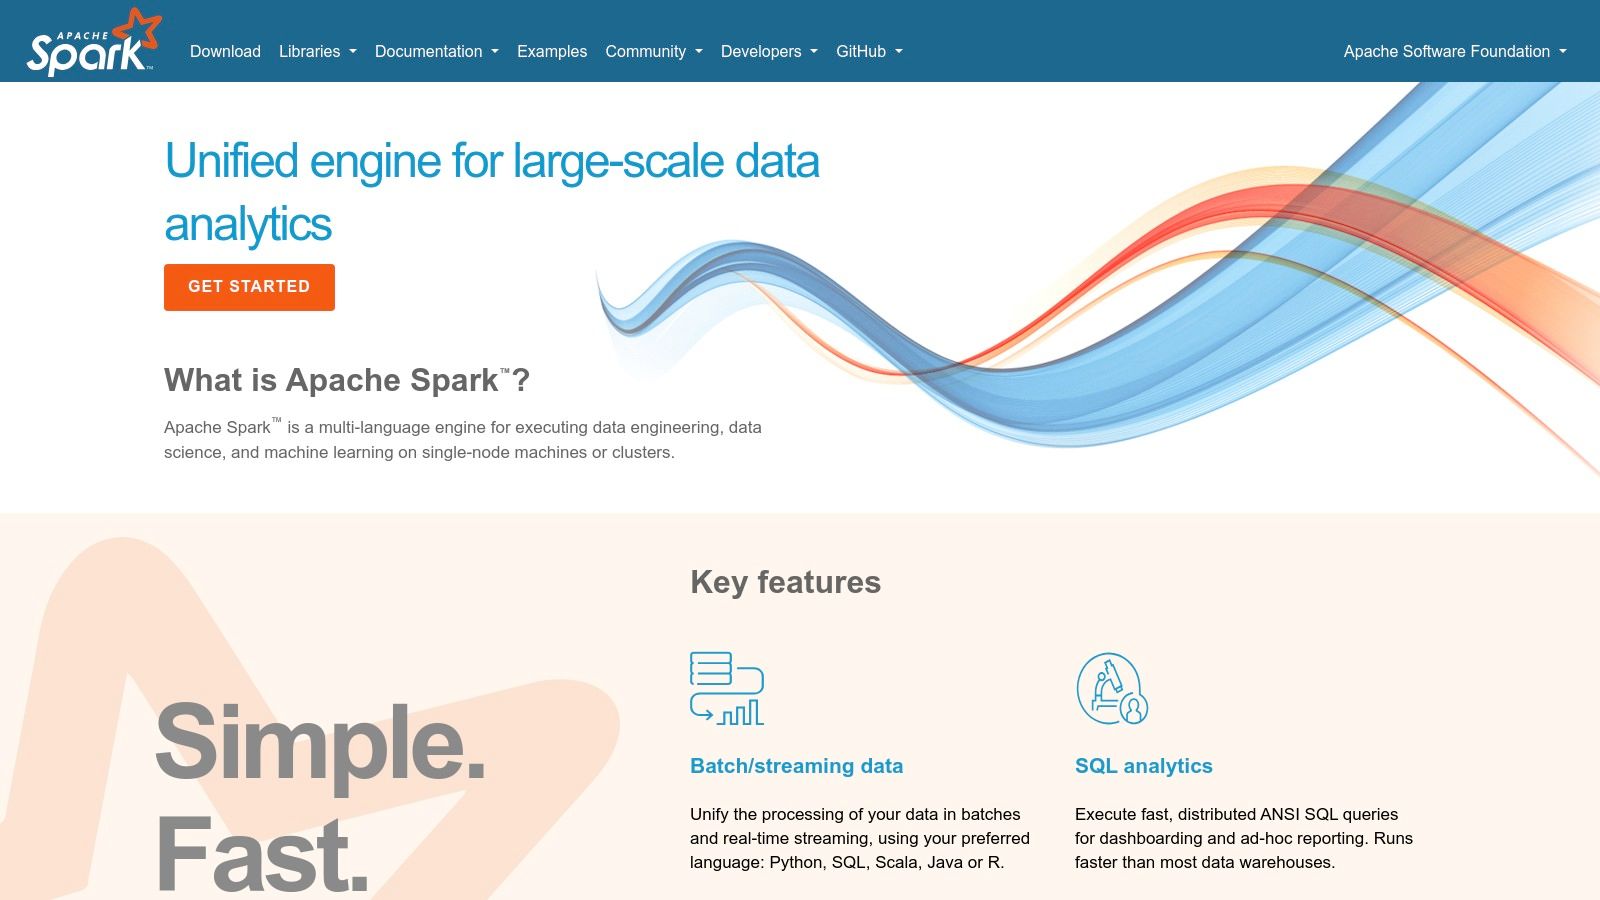
10. Apache Spark (with PySpark)
Apache Spark is a powerful open-source unified analytics engine designed for large-scale data processing. It shines when dealing with massive datasets that would overwhelm traditional tools like Excel or even smaller database systems. Through PySpark, its Python API, Spark becomes accessible to a wide range of users, offering robust capabilities for big data analysis, including machine learning, streaming data processing, and SQL operations, all executed across distributed computing clusters. This makes it a compelling choice for free data analysis tools, especially for those working with substantial datasets and complex analytical needs.
Imagine a marketing manager needing to analyze campaign ROI across millions of customer touchpoints, or a financial analyst building a complex model incorporating years of market data. These are scenarios where Spark’s distributed computing power becomes invaluable. By distributing the workload across a cluster of computers, Spark can process vast amounts of data significantly faster than single-machine tools. Its in-memory computing capabilities further enhance performance, enabling rapid data access and manipulation.
One of Spark's key advantages is its versatility. While PySpark offers a user-friendly Python interface, Spark also supports other languages like Java, Scala, and R, catering to diverse skill sets within an organization. Its built-in machine learning library (MLlib) empowers users to perform advanced analytics like classification, regression, and clustering without relying on external tools. Moreover, Spark's streaming capabilities allow for real-time analysis of incoming data, enabling businesses to react quickly to changing trends and events. For those familiar with SQL, SparkSQL provides a familiar interface for querying large datasets stored within the Spark ecosystem.
For instance, a sales manager could use Spark to analyze sales data across multiple regions and product lines, identifying top performers and areas for improvement. An operations manager could leverage Spark’s streaming capabilities to monitor inventory levels in real-time and trigger automated replenishment orders. Financial analysts can leverage Spark to process large financial datasets, conduct risk assessments, and build predictive models for investment strategies.
While Spark offers tremendous power, it's essential to acknowledge its complexity. Setting up and configuring a Spark cluster can be challenging, especially for users without prior experience with distributed computing. The learning curve can be steep, requiring time and effort to master the concepts and tools involved. For smaller datasets, Spark can be overkill, and simpler tools might be more appropriate. Therefore, understanding the technical requirements and resource implications is crucial before adopting Spark.
Features:
- Distributed computing for big data processing
- In-memory computing for faster performance
- Built-in machine learning library (MLlib)
- Streaming data processing capabilities
- SQL queries on large datasets (SparkSQL)
- Supports multiple programming languages (Python, Java, Scala, R)
Pros:
- Excellent for big data and large-scale analysis
- Fast in-memory processing
- Supports multiple programming languages
- Strong ecosystem and industry adoption
Cons:
- Complex setup and configuration
- Steep learning curve
- Overkill for small datasets
- Requires distributed computing knowledge
Pricing: Apache Spark is open-source and free to use. However, running Spark on a cluster often involves infrastructure costs, such as cloud computing resources.
Technical Requirements: Spark requires a Java Runtime Environment (JRE) and can be deployed on various platforms, including Hadoop, Kubernetes, and standalone clusters.
Implementation/Setup Tips:
- Start with a pre-built Spark environment offered by cloud providers like AWS EMR, Google Dataproc, or Azure HDInsight to simplify setup.
- Utilize PySpark for easier access through Python’s familiar syntax and libraries.
- Explore online tutorials and documentation to learn the fundamentals of Spark and PySpark.
- Start with smaller datasets and gradually increase the scale as you gain experience.
Comparison with Similar Tools: Compared to tools like Hadoop MapReduce, Spark offers significantly faster performance due to its in-memory processing capabilities. While tools like Pandas are excellent for data manipulation on smaller datasets, Spark scales far better for large-scale analysis.
Website: https://spark.apache.org
Apache Spark, particularly with its PySpark interface, earns its place among free data analysis tools because of its ability to handle massive datasets and perform complex analytics that would be impossible with traditional tools. While it does require a greater investment in learning and setup, its power and scalability make it a valuable asset for organizations and individuals dealing with big data challenges.
Key Feature Comparison of 10 Free Data Analysis Tools
| Tool | Core Features/Capabilities | User Experience & Quality | Value Proposition | Target Audience | Price |
|---|---|---|---|---|---|
| 🏆 AIForExcel | Natural language formula generation ✨, Seamless Excel integration | ★★★★☆ Instant, easy, error-free | 💰 Starting €20/month, saves hours | 👥 Business pros, managers, SMB owners | 💰 Paid, 30-day guarantee |
| R | Comprehensive stats & graphics, vast package ecosystem | ★★★★☆ Powerful but steep learning curve | ★ Free, extensible, research grade | 👥 Statisticians, researchers | ★ Free |
| Python (Pandas, NumPy, Matplotlib) | Data manipulation, visualization, ML support | ★★★★☆ Versatile but requires coding | ★ Free, strong community | 👥 Data scientists, analysts | ★ Free |
| Apache OpenOffice Calc | Spreadsheet with pivot tables & charts | ★★★☆ Familiar UI, fewer advanced features | ★ Free, Excel-compatible | 👥 Non-programmers, budget-conscious users | ★ Free |
| KNIME Analytics Platform | Visual workflows, 2000+ nodes, ML & integration | ★★★★ Intuitive drag-drop, some complexity | ★ Free with optional paid add-ons | 👥 Data analysts, non-coders | ★ Free / Paid extensions |
| Orange | Visual programming, interactive data viz, ML widgets | ★★★☆ Beginner-friendly, visualization focus | ★ Free, educative | 👥 Beginners, educators, data viz lovers | ★ Free |
| GNU PSPP | SPSS-like stats, GUI & CLI, SPSS file compatible | ★★★☆ Basic but effective, limited polish | ★ Free, SPSS alternative | 👥 Social scientists, statisticians | ★ Free |
| Jupyter Notebook | Live code, multi-language, rich docs, visualization | ★★★★ Interactive, reproducible, coding req | ★ Free, popular in academia & industry | 👥 Data scientists, researchers | ★ Free |
| RStudio (Community Edition) | IDE for R, syntax highlighting, plotting | ★★★★ Improves R usability | ★ Free, powerful for R users | 👥 R programmers, data analysts | ★ Free |
| Apache Spark (with PySpark) | Distributed big data, MLlib, in-memory processing | ★★★★ High power, complex setup | ★ Free, excels in big data | 👥 Big data engineers, data scientists | ★ Free |
Choosing the Right Tool for Your Data Analysis Journey
This article explored a diverse range of free data analysis tools, each offering unique strengths for different needs. From AI-powered Excel enhancements to robust programming languages like R and Python, and visual platforms like KNIME and Orange, the options are plentiful. Key takeaways include the importance of considering your technical skills, the size and complexity of your data, and the specific types of analysis you need to perform. For instance, if you're dealing with massive datasets, Apache Spark is a powerful choice. If you prioritize a code-free experience, visual tools like Orange may be the perfect fit. And for those looking to boost their Excel productivity with the power of AI, tools like AIForExcel offer a compelling solution. When implementing any new tool, remember to factor in the learning curve, available documentation and community support, and integration with your existing workflows.
The right free data analysis tools empower you to unlock the potential hidden within your data, regardless of your technical expertise or budget. By carefully considering your specific requirements and exploring the options outlined here, you can choose the perfect tool to embark on your data analysis journey with confidence. Ready to supercharge your Excel spreadsheets with the help of AI? Explore the power of AIForExcel, a free tool designed to simplify and accelerate your data analysis workflows, at AIForExcel. It's the perfect solution for anyone looking to leverage the familiarity of Excel with the cutting edge of AI-driven insights.