Unlocking 2025's Potential: Your Guide to Sales Forecasting
Want to accurately predict your 2025 sales? This guide reveals seven powerful sales forecasting techniques to project revenue and inform strategic planning. Learn how time series analysis, pipeline analysis, moving averages, regression analysis, bottom-up forecasting, top-down forecasting, and machine learning/AI forecasting can empower data-driven decisions. Whether you're a beginner or an expert, these sales forecasting techniques will help you unlock growth and maximize your 2025 potential.
1. Time Series Analysis
Time series analysis is a powerful sales forecasting technique that leverages historical sales data to predict future performance. It operates on the principle that past patterns in sales data can offer valuable insights into future trends. By identifying these patterns, such as seasonal variations, trends, and cyclical fluctuations, businesses can make more informed decisions about inventory management, resource allocation, and overall strategic planning. This method is particularly valuable for businesses with established historical data and relatively predictable sales cycles. Time series analysis employs statistical models to analyze historical data points ordered chronologically, effectively extrapolating these past patterns to generate forecasts. This allows businesses to anticipate future demand and optimize their operations accordingly.

This technique is especially useful for sales forecasting because it provides a data-driven and objective approach to predicting future sales, minimizing guesswork and subjective biases. Furthermore, its ability to identify subtle trends that might be missed by human observation allows for more nuanced and accurate forecasting. Time series analysis is readily applicable to short-to-medium-term forecasting, making it a practical tool for businesses looking to optimize their operations in the near future. Several statistical models, such as ARIMA (Autoregressive Integrated Moving Average) and exponential smoothing, are employed within time series analysis, each with its own strengths and suited to different types of data patterns. More sophisticated models can even incorporate external factors like economic indicators or marketing campaign data, providing a more comprehensive and accurate forecast. A key benefit of many time series models is the ability to generate confidence intervals, providing a range of likely outcomes and a measure of the forecast's reliability.
For example, Walmart uses time series analysis to anticipate the demand for seasonal items like holiday decorations, ensuring they have sufficient stock to meet customer needs without overstocking. Airlines utilize this technique to predict passenger demand, allowing them to optimize pricing strategies and flight schedules. Retail chains also leverage time series analysis to forecast inventory needs based on historical sales patterns, minimizing storage costs and preventing stockouts.
To effectively use time series analysis for sales forecasting, consider the following tips:
- Data Quality and Consistency: Begin by ensuring the accuracy, completeness, and consistency of your historical sales data. Clean and reliable data is crucial for generating accurate forecasts.
- Model Selection: Start with simpler models like moving averages or exponential smoothing before progressing to more complex models like ARIMA. This allows for a gradual understanding of the data and prevents unnecessary complexity.
- Regular Updates: Regularly validate and update your models with new data to maintain their accuracy and relevance. Sales patterns can shift over time, so regular adjustments are necessary.
- External Factors: Consider incorporating external factors such as economic indicators, marketing campaigns, or competitor activity into your models to enhance forecasting accuracy.
- Comparative Analysis: Use multiple time series models and compare their results to identify the best fit for your specific data and business context.
While time series analysis offers numerous advantages, it's crucial to be aware of its limitations. It requires a significant amount of historical data to function effectively, making it less suitable for new businesses or products with limited historical information. The technique also assumes that past patterns will continue into the future, which may not hold true in the face of sudden market shifts, disruptive innovations, or unexpected external events. New product launches or significant changes in market dynamics can also pose challenges for time series models. Furthermore, complex time series models often require statistical expertise for proper implementation and interpretation. Despite these limitations, time series analysis remains a powerful and widely used sales forecasting technique, offering valuable insights for businesses across diverse industries. Its data-driven approach, ability to identify subtle trends, and relative ease of implementation for simpler models make it a valuable addition to any sales forecasting toolkit. By understanding its strengths and limitations and following the tips outlined above, businesses can leverage time series analysis to improve their forecasting accuracy and optimize their operations for future success.
2. Pipeline Analysis
Pipeline analysis is a powerful sales forecasting technique that provides a forward-looking view of potential revenue by evaluating current sales opportunities. Unlike historical forecasting methods, pipeline analysis focuses on real-time data and active deals, offering valuable insights into short-term and long-term sales performance. It's particularly well-suited for B2B sales environments with longer sales cycles and complex deal structures. This method earns its place on the list of essential sales forecasting techniques because it bridges the gap between sales activities and revenue outcomes, enabling proactive sales management and informed decision-making. Learn more about Pipeline Analysis
At its core, pipeline analysis involves tracking deals as they progress through defined stages in the sales process. Each stage, from initial contact to closing, is assigned a probability percentage representing the likelihood of a deal successfully moving to the next stage and ultimately closing. For example, a deal in the "proposal" stage might have a 60% probability of closing, while a deal in the "negotiation" stage might have an 80% probability. This probability weighting allows for a more realistic and nuanced forecast than simply summing up the value of all deals in the pipeline.
The weighted forecast is calculated by multiplying each deal's value by its corresponding probability of closing. By aggregating these weighted values across all deals in the pipeline, sales teams can generate a forecast that reflects the current market conditions and the probability of closing each opportunity. This method offers a significant advantage over simpler forecasting methods by incorporating the dynamic nature of sales opportunities.
The following infographic visualizes the three key steps in the Pipeline Analysis method: defining sales stages, assigning probabilities, and calculating the weighted forecast.
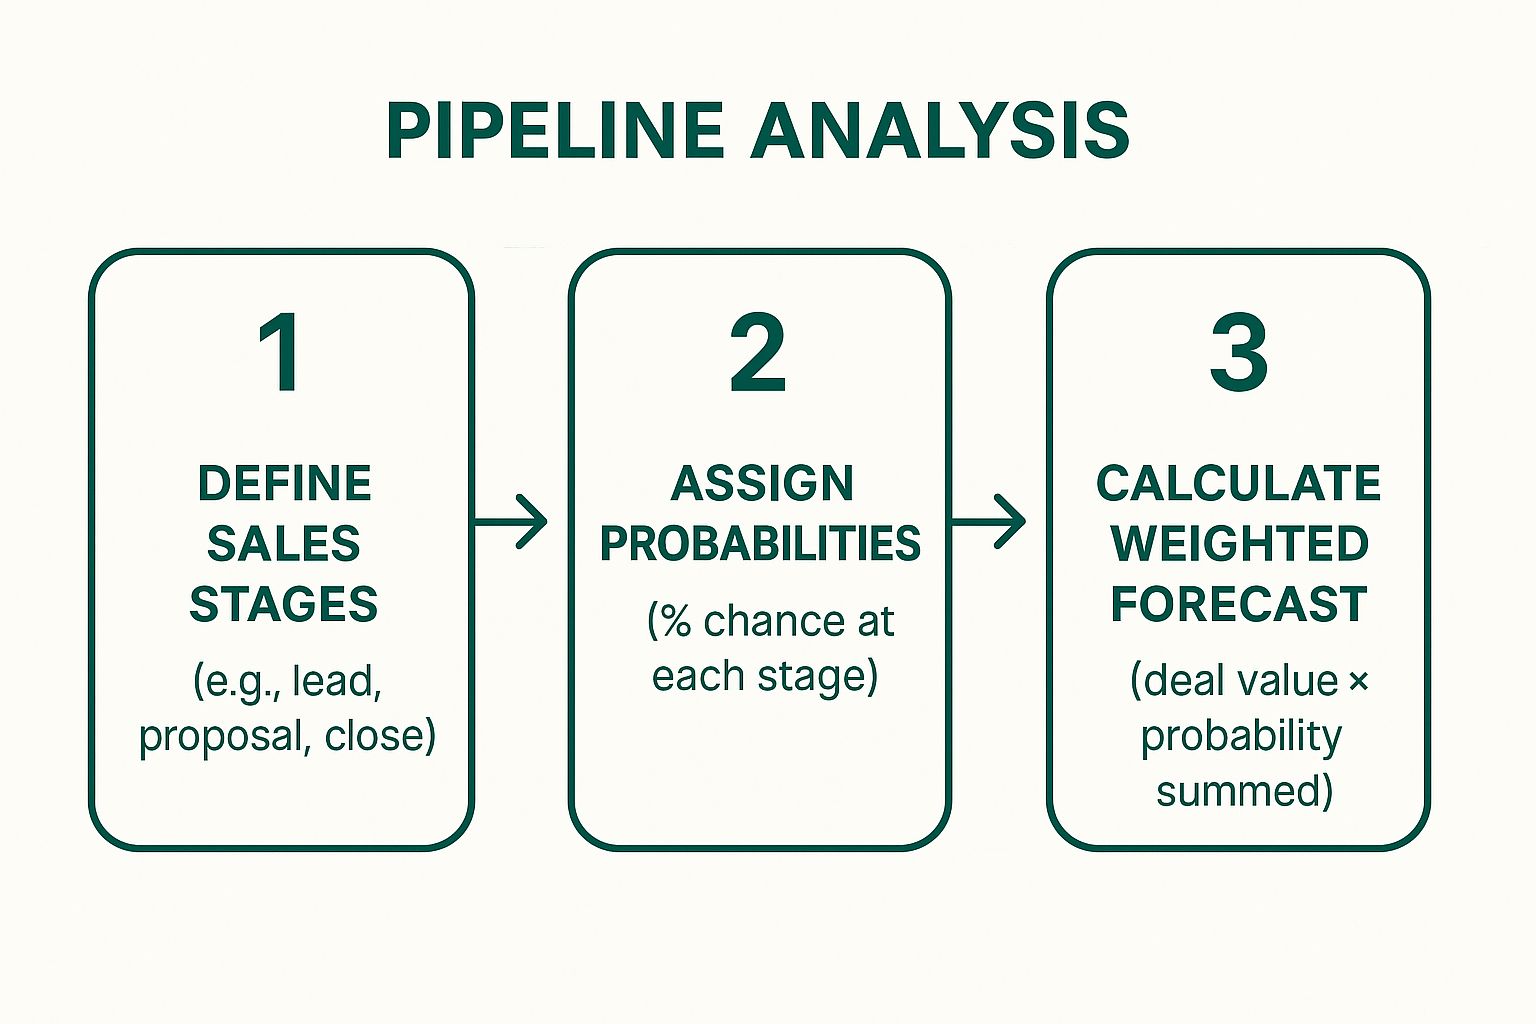
As the infographic demonstrates, the process flows from defining clear sales stages to calculating a final weighted forecast by considering the assigned probabilities. This sequential approach ensures a structured and reliable pipeline analysis.
Features and Benefits: Pipeline analysis offers several features that contribute to its effectiveness:
- Real-Time Pipeline Visibility: Provides an up-to-the-minute view of the sales pipeline, enabling quick responses to changing market dynamics.
- Detailed Sales Process Insights: Highlights bottlenecks and areas for improvement within the sales funnel by tracking deal progression.
- Segmentation Capabilities: Allows for analysis by sales rep, territory, product, or other relevant segments, providing granular insights.
- Proactive Sales Management: Enables sales managers to identify potential risks and opportunities, adjust strategies, and allocate resources effectively.
Pros:
- Reflects current market conditions and opportunities.
- Provides detailed visibility into the sales process.
- Helps identify bottlenecks in the sales funnel.
- Enables proactive sales management.
- Works well for B2B sales with longer cycles.
Cons:
- Dependent on the sales team's accuracy in updating the pipeline.
- Subjective probability assessments can be biased.
- Requires well-defined sales processes and stages.
- May overestimate if probabilities are too optimistic.
- Doesn't account for deals not yet in the pipeline.
Examples of Successful Implementation: Companies like Salesforce, HubSpot, and Oracle leverage pipeline analysis extensively for revenue forecasting and sales management. Salesforce uses pipeline analysis within their CRM platform, offering real-time visibility and forecasting tools. HubSpot provides similar pipeline forecasting tools specifically designed for B2B companies. Oracle’s sales teams utilize pipeline analysis for quarterly revenue projections.
Tips for Effective Pipeline Analysis:
- Define Clear Criteria for Each Sales Stage: Establish objective criteria for each stage to ensure consistent classification of deals.
- Regularly Review and Calibrate Probability Percentages: Continuously review and adjust probability percentages based on historical data and market trends.
- Train Sales Team on Consistent Pipeline Management: Ensure the sales team understands the importance of accurate and timely pipeline updates.
- Use Historical Win Rates to Validate Probabilities: Leverage past performance data to refine probability assignments and improve forecast accuracy.
- Include Deal Velocity Metrics in Analysis: Consider the speed at which deals move through the pipeline to enhance forecasting precision.
By following these tips and incorporating pipeline analysis into your sales forecasting strategy, you can gain a more accurate and actionable view of future revenue, empowering your sales team to achieve better results.
3. Moving Averages
Moving averages are a fundamental sales forecasting technique known for its simplicity and effectiveness in smoothing out short-term fluctuations in sales data. This method calculates the average of sales figures over a specific number of periods, using this average as the forecast for the next period. As new data becomes available, older data points are dropped from the calculation, ensuring the forecast continuously adapts to the most recent trends. This characteristic makes moving averages particularly useful for discerning underlying trends when data is noisy or contains random variations, providing a clearer picture of overall sales performance.
Here's how it works: Let's say you're using a 3-month moving average. You'll take the sales figures from the past three months, sum them up, and divide by three to get the average. This average then becomes your sales forecast for the upcoming month. Next month, you'll drop the oldest month's data and add the most recent month's sales figures, repeating the calculation for a new forecast. This continuous rolling update allows the moving average to reflect current market conditions and adjust to emerging trends.
There are two main variations of moving averages: simple and weighted. The simple moving average treats all periods equally, giving each data point the same weight in the calculation. The weighted moving average, on the other hand, assigns different weights to each period, typically giving more weight to recent data points. This allows for greater responsiveness to recent shifts in sales patterns.
Several industries successfully utilize moving averages for various forecasting needs. For example, McDonald's uses this technique to predict daily food preparation requirements, optimizing inventory and minimizing waste. Stock traders rely on moving averages to identify potential trend reversals and make informed investment decisions. Manufacturing companies employ moving averages to forecast raw material needs, streamlining production processes and ensuring efficient resource allocation. These examples illustrate the versatility and applicability of this forecasting method across diverse sectors.
When and Why to Use Moving Averages:
Moving averages are an excellent choice for forecasting when:
- Demand is relatively stable: In scenarios where sales patterns don't exhibit drastic fluctuations, moving averages provide a reliable forecast.
- Identifying underlying trends is crucial: The smoothing effect of moving averages helps filter out noise and highlights longer-term trends.
- Simplicity and ease of understanding are prioritized: Moving averages are easy to calculate and interpret, making them accessible to a wide range of users, from those in management roles to those handling operational data.
- Computational resources are limited: This method requires minimal computational power, making it suitable for situations where complex modeling isn't feasible.
Pros of Using Moving Averages:
- Simple to implement and understand: Requires basic mathematical skills and can be easily implemented in spreadsheets or dedicated forecasting software.
- Minimal historical data required: Unlike some more sophisticated techniques, moving averages can generate forecasts with relatively little historical data.
- Automatic incorporation of recent trends: The rolling calculation continuously updates the forecast, reflecting the latest sales data.
- Good for stable demand patterns: Provides accurate forecasts when sales are relatively consistent.
- Low computational requirements: Doesn't demand significant processing power.
Cons of Using Moving Averages:
- Lags behind actual trends: The averaging process inherently creates a lag, meaning the forecast reacts to changes with a delay.
- Doesn't handle seasonal patterns well: Moving averages don't inherently account for seasonality, which can lead to inaccurate forecasts in businesses with strong seasonal sales cycles.
- All periods weighted equally in the simple version: This can be a drawback when recent data is more indicative of future performance.
- Poor performance with volatile data: Significant fluctuations in sales data can lead to unreliable forecasts.
- Provides no confidence intervals: Doesn't offer a measure of forecast uncertainty.
Tips for Effective Implementation:
- Choose an appropriate time period length: A period of 3-12 months is commonly used, but the optimal length depends on the specific business and sales cycle. Shorter periods are more responsive to recent changes, while longer periods provide greater smoothing.
- Use weighted moving averages for more recent emphasis: Assigning higher weights to more recent data points can improve forecast accuracy when trends are shifting.
- Combine with other methods for better accuracy: Moving averages can be combined with other forecasting techniques, such as exponential smoothing or seasonality adjustments, to improve overall performance.
- Monitor forecast errors and adjust period length: Regularly evaluate the accuracy of the forecasts and adjust the period length as needed.
- Consider exponential smoothing for better trend responsiveness: If responsiveness to trends is a priority, exponential smoothing might be a more suitable alternative.
By understanding the mechanics, benefits, limitations, and best practices associated with moving averages, businesses can effectively leverage this simple yet powerful tool to gain valuable insights into future sales trends and make data-driven decisions.
4. Regression Analysis
Regression analysis is a powerful statistical sales forecasting technique that allows businesses to understand and quantify the relationships between their sales (the dependent variable) and various influencing factors (independent variables). These factors can include anything from marketing spend and economic indicators to seasonality, competitor actions, and even pricing strategies. By establishing these relationships, regression analysis helps you predict future sales based on anticipated values for these influencing factors. It's a cornerstone of data-driven decision-making, enabling you to move beyond simple guesswork and towards more informed and accurate sales projections.
This method works by creating a mathematical equation that represents the relationship between sales and the chosen independent variables. For instance, a simple linear regression might show that for every $10,000 increase in advertising spend, sales increase by $50,000. More complex regressions can incorporate numerous variables simultaneously, providing a more nuanced view of how different factors interact to influence sales outcomes. One of the key advantages of regression analysis is its ability to provide statistical significance testing, which helps determine if the observed relationships are genuinely meaningful or simply due to chance. Furthermore, it quantifies the impact of each variable, allowing you to prioritize the most impactful drivers of your sales.
Several successful implementations highlight the power of regression analysis. Coca-Cola, for instance, utilizes regression to understand the impact of their advertising campaigns on sales volume, allowing them to optimize ad spending for maximum ROI. Similarly, streaming giants like Netflix leverage regression analysis to analyze the relationship between content investment and subscriber growth, a crucial factor in their strategic planning. In the automotive industry, companies use regression models to forecast sales based on economic indicators like consumer confidence and unemployment rates, as well as the impact of sales incentives and promotional offers.
When and why should you use regression analysis for sales forecasting? This technique is particularly valuable when:
- Multiple factors influence your sales: If your sales are affected by a variety of factors, regression analysis can help untangle those influences and quantify their individual contributions.
- You need to understand cause-and-effect: Regression helps identify which factors truly drive sales, as opposed to simply correlating with them. This understanding can lead to more effective interventions and strategic decisions.
- You want to test different scenarios: By manipulating the values of the independent variables in your regression model, you can simulate the impact of different business decisions, such as increasing marketing spend or launching a new product.
- You require a statistically rigorous approach: Regression provides a robust framework for testing hypotheses and generating predictions with a quantifiable level of confidence.
However, regression analysis isn't without its drawbacks:
- Requires statistical understanding: Effectively using regression requires a basic understanding of statistical concepts like p-values, R-squared, and multicollinearity.
- Assumption of linear relationships (in basic form): Simple linear regression assumes a linear relationship between variables. While more advanced techniques can handle non-linear relationships, they add complexity.
- Needs quality data: Accurate predictions rely on high-quality data for all variables included in the model. Missing or inaccurate data can significantly skew the results.
- Can be affected by multicollinearity: When independent variables are highly correlated with each other, it can be difficult to isolate their individual effects on the dependent variable.
To effectively use regression analysis for sales forecasting, consider the following tips:
- Start simple: Begin with a simple linear regression model with one or two key variables before adding complexity.
- Validate assumptions: Ensure your data meets the assumptions of the regression model you're using (e.g., normal distribution of residuals).
- Check for correlation: Examine the correlation between your independent variables to identify potential multicollinearity issues.
- Cross-validate: Use techniques like cross-validation to assess the accuracy and generalizability of your model.
- Update regularly: Regularly update your regression models with new data to maintain their accuracy and relevance.
Learn more about Regression Analysis and explore how tools like Excel can be utilized for this technique. Regression analysis, popularized by statistical software companies like SAS, academic researchers, and business intelligence platforms, remains a valuable sales forecasting technique that empowers businesses with data-driven insights. By understanding its strengths and limitations, and by following best practices, you can leverage this powerful tool to improve your sales forecasts and drive better business outcomes.
5. Bottom-Up Forecasting
Bottom-up forecasting is a sales forecasting technique that builds predictions from the ground up, leveraging the granular knowledge of individual sales representatives and regional managers who are closest to the market. Instead of relying on high-level market trends or historical data alone, this method aggregates individual forecasts for specific territories, products, or even individual customer accounts to create a comprehensive company-wide sales prediction. This approach makes it a particularly valuable tool for businesses seeking detailed insights into their sales pipeline and potential market fluctuations. Its inherent focus on the micro-level details of the sales process earns it a crucial place in the arsenal of any sales forecasting toolkit.
How it Works:
The process begins with individual sales contributors, such as sales representatives or regional managers, forecasting sales for their assigned areas of responsibility. This could involve predicting sales for specific products within a territory, forecasting the potential revenue from key accounts, or estimating sales based on projected lead conversion rates within their assigned customer base. These individual forecasts are then reviewed by their respective managers for reasonableness and consistency. Once approved, these individual forecasts are aggregated at successively higher levels within the sales organization – from team level to district, region, and finally to the company-wide level. This layered approach provides a detailed, composite picture of anticipated sales performance.
Examples of Successful Implementation:
Several organizations across various industries have effectively implemented bottom-up forecasting:
- IBM: IBM's global sales teams utilize bottom-up forecasting, with individual representatives providing territory-specific forecasts that are then rolled up into regional and global projections. This allows IBM to incorporate local market conditions and individual customer relationships into their overall revenue forecasts.
- Pharmaceutical Companies: Many pharmaceutical companies use bottom-up forecasting, relying on regional sales managers to project sales based on physician prescribing patterns, local market access, and competitive dynamics within their territories. These forecasts are then aggregated to provide a national sales outlook for specific medications.
- Technology Distributors: Distributors working with a network of partner channels often employ bottom-up forecasting. Each partner provides sales estimates for their respective territories and customer segments, which are then combined to create the distributor's overall sales projection. This approach accounts for the unique strengths and market reach of each partner within the distribution network.
Actionable Tips for Implementation:
To effectively implement bottom-up forecasting, consider these tips:
- Provide Clear Guidelines and Templates: Ensure consistency and accuracy by providing all contributors with clear guidelines on the forecasting process, along with standardized templates for submitting their predictions.
- Training on Forecasting Best Practices: Invest in training sales teams on forecasting best practices and methodologies. This equips them with the necessary skills to create more accurate and reliable forecasts.
- Implement Review Processes to Check for Bias: Establish a system of reviews by sales managers to identify and mitigate potential biases, ensuring that forecasts are grounded in realistic market conditions and customer behavior.
- Use Historical Accuracy to Weight Contributions: Consider weighting individual contributions based on historical forecasting accuracy. Contributors with a proven track record of accurate forecasting can be given higher weighting in the overall projection.
- Combine with Top-Down Validation: For a more robust forecast, combine bottom-up forecasts with top-down forecasts based on market trends and historical data. This can help identify discrepancies and refine the final sales projection.
Pros and Cons of Bottom-Up Forecasting:
Pros:
- Leverages Detailed Local Market Knowledge: Captures granular insights from the individuals closest to customers.
- Increases Sales Team Buy-in and Accountability: Fosters ownership and commitment to achieving the forecast.
- Captures Nuanced Customer-Specific Information: Incorporates details about individual customer needs and buying patterns.
- Identifies Opportunities and Risks Early: Allows for proactive adjustments to sales strategies.
- Encourages Ownership of Results: Motivates sales teams to achieve their individual and collective goals.
Cons:
- Time-Intensive Process Requiring Coordination: Can be complex and challenging to manage across a large sales organization.
- Individual Biases Can Compound: Individual optimism or pessimism can skew the overall forecast.
- May Lack Strategic Perspective: May not adequately reflect broader market trends or competitive pressures.
- Inconsistent Methodologies Across Contributors: Variations in forecasting approaches can lead to inaccuracies.
- Tends Toward Conservative Estimates: Sales representatives may underestimate sales to avoid missing targets.
When to Use Bottom-Up Forecasting:
Bottom-up forecasting is particularly valuable in the following scenarios:
- Businesses with complex product portfolios or diverse customer segments.
- Companies operating in rapidly changing or volatile markets.
- Organizations with a strong sales culture and engaged sales teams.
- Situations where detailed, customer-specific information is readily available.
By leveraging the collective intelligence of the sales force, bottom-up forecasting provides a powerful tool for developing accurate and actionable sales predictions. While it requires careful planning and execution, the potential benefits in terms of improved sales performance and strategic decision-making make it a worthwhile investment for many organizations.
6. Top-Down Forecasting
Top-down forecasting is a strategic sales forecasting technique that takes a macro-level view of the market and works its way down to a specific sales projection. It begins by estimating the total market size for a product or service and then determines the company's potential market share within that market. This establishes the Total Addressable Market (TAM), representing the maximum potential revenue if the company captured 100% of the market. From the TAM, the forecast is broken down into smaller, more manageable segments like product lines, regions, or customer groups. This hierarchical approach typically involves senior management setting high-level targets based on comprehensive market research, competitive analysis, and the company's overall strategic objectives.
This method stands in contrast to bottom-up forecasting, which aggregates individual sales rep projections to arrive at a total forecast. Top-down forecasting, instead, prioritizes a broader market perspective, making it particularly well-suited for specific scenarios. For instance, when launching a new product into a relatively uncharted market, a bottom-up approach may be impossible due to the lack of historical data. In such cases, top-down forecasting provides a valuable framework for estimating potential sales based on market trends and competitive dynamics. It is also useful for established companies entering new markets, allowing them to leverage existing market data to project their potential penetration.
How Top-Down Forecasting Works:
Market Size Determination: Extensive market research is crucial. This involves analyzing industry reports, conducting surveys, and leveraging competitor data to estimate the overall market size for the product or service. Understanding market growth trends and potential future changes is paramount.
Market Share Estimation: This step requires a realistic assessment of the company's potential market share. Factors to consider include competitive landscape, brand recognition, pricing strategy, distribution channels, and overall marketing effectiveness. Competitive intelligence plays a key role in understanding the market share distribution amongst competitors.
Total Addressable Market (TAM) Calculation: Multiplying the estimated market size by the projected market share yields the TAM. This figure represents the maximum revenue opportunity available to the company.
Segmentation and Breakdown: The TAM is then systematically broken down into smaller segments. This might involve segmenting by product line, geographical region, customer type, or sales channel. This hierarchical breakdown allows for a more granular and focused approach to forecasting.
Target Setting and Refinement: Senior management typically uses the segmented forecasts to set sales targets for different departments and teams. These targets are then reviewed and refined based on operational feasibility and resource availability.
Examples of Successful Implementation:
Apple: When forecasting iPhone sales, Apple analyzes the overall growth of the smartphone market, considering factors like technological advancements, economic conditions, and competitor activities. They then estimate their market share based on their brand strength, product innovation, and pricing strategy.
Tesla: Tesla estimates vehicle sales by projecting the growth of the electric vehicle (EV) market, factoring in government regulations, charging infrastructure development, and consumer adoption rates. They then consider their own production capacity and competitive positioning to arrive at a sales forecast.
Streaming Services: Companies like Netflix forecast subscriber growth by analyzing cord-cutting trends, internet penetration rates, and the competitive landscape of the streaming industry.
Tips for Effective Top-Down Forecasting:
Diverse Market Research: Rely on multiple reputable market research sources to ensure a comprehensive understanding of market dynamics and minimize biases.
Bottom-Up Validation: Conduct bottom-up sanity checks to validate the top-down forecast. This involves comparing the top-down projection with the aggregated forecasts from individual sales teams to identify any significant discrepancies.
Competitive Analysis: Consider how competitors might respond to your actions and adjust your market share assumptions accordingly.
Market Maturity: Account for market maturity and saturation. Growth rates in mature markets tend to slow down, requiring adjustments to market size projections.
Regular Review: Regularly review and adjust market assumptions based on emerging trends and changing market conditions. Dynamic market forces necessitate ongoing monitoring and adaptation.
Pros and Cons of Top-Down Forecasting:
Pros:
- Strategic Alignment: Maintains a strong strategic perspective and ensures alignment with overall business objectives.
- Market Awareness: Considers overall market conditions and trends.
- Efficiency: Generally faster than bottom-up approaches, particularly for new products or markets.
- Consistency: Provides a consistent methodology across the organization.
- New Market Entry: Well-suited for planning new market entry strategies.
Cons:
- Local Nuances: May miss crucial local market nuances and variations.
- Operational Disconnect: Can be disconnected from operational realities and sales team feedback.
- Research Dependency: Heavily reliant on the accuracy of market research data.
- Customer Specificity: May not reflect individual customer situations or buying behaviors.
- Unrealistic Targets: Risk of setting unrealistic sales targets if market assumptions are flawed.
Despite its limitations, top-down forecasting remains a valuable tool for strategic sales planning, particularly in situations where detailed historical data is unavailable or when a broad market perspective is required. By combining this method with bottom-up validation and regular review, businesses can develop more robust and reliable sales forecasts.
7. Machine Learning and AI Forecasting
Machine learning (ML) and artificial intelligence (AI) are transforming sales forecasting from a largely manual, intuition-based process to a data-driven, predictive science. These advanced techniques leverage powerful algorithms to sift through vast quantities of data, uncovering complex patterns and relationships that traditional methods often miss. Unlike simpler models that rely on linear relationships and historical trends, ML and AI can identify non-linear patterns and incorporate diverse data sources, including historical sales data, economic indicators, weather patterns, social media sentiment, and even real-time data feeds. This multifaceted approach allows for the creation of sophisticated predictive models that continuously learn and improve over time, offering increasingly accurate sales forecasts.

This forecasting technique shines when dealing with complex, multi-variable scenarios. Imagine trying to predict sales for a global e-commerce giant like Amazon, with millions of products, diverse customer segments, and fluctuating market conditions. Traditional methods would struggle to capture the intricacies of such a dynamic environment. However, ML algorithms can effortlessly process massive datasets, identifying subtle correlations between seemingly unrelated variables, leading to more accurate and granular predictions. Companies like Amazon, Uber, and Netflix are already reaping the benefits of ML and AI forecasting. Amazon uses it to predict demand across its vast product catalog, Uber utilizes it to forecast ride demand based on location and time, and Netflix leverages it to predict content demand and tailor viewing recommendations. These examples showcase the power of ML and AI to solve complex forecasting challenges across various industries.
For mid-level managers, department heads, or anyone dealing with data-driven decision-making, understanding the potential of ML and AI forecasting is crucial. Project managers tracking budgets and resources, operations managers optimizing inventory and logistics, or financial analysts building complex models can all leverage these techniques to enhance their predictive capabilities. Even solo entrepreneurs, small business owners, and freelancers can benefit from these advanced tools, especially with resources like Learn more about Machine Learning and AI Forecasting making AI more accessible within familiar platforms like Excel.
While the benefits are undeniable, implementing ML and AI for sales forecasting also presents challenges. These sophisticated systems require significant technical expertise, often demanding specialized data science skills or partnerships with external vendors. The initial implementation and ongoing maintenance costs can be substantial. Furthermore, the “black box” nature of some algorithms can make it difficult to interpret the underlying logic behind the predictions, hindering transparency and trust. Finally, ML models are data-hungry and require large volumes of high-quality data to train effectively. Insufficient or biased data can lead to inaccurate predictions or overfitting to historical patterns, rendering the model less effective in predicting future trends.
To successfully implement ML and AI forecasting, consider these tips:
- Start with clean, high-quality data: Data cleansing and preprocessing are crucial for accurate model training.
- Begin with simpler algorithms: Start with simpler models before moving to more complex ones to gain understanding and establish a baseline.
- Combine with traditional methods initially: Integrating ML with existing forecasting methods can provide a smoother transition and offer valuable insights.
- Invest in data science talent or partnerships: Acquiring the necessary expertise is essential for successful implementation and ongoing model maintenance.
- Regularly validate and retrain models: Continuously evaluate model performance and retrain with updated data to maintain accuracy and adapt to changing market conditions.
Despite the challenges, the potential of ML and AI forecasting is undeniable. The ability to process massive datasets, identify intricate patterns, and continuously learn makes these techniques invaluable for accurate and dynamic sales predictions. By carefully considering the pros and cons, following best practices, and staying informed about new advancements, businesses can leverage the power of ML and AI to gain a competitive edge in today's data-driven world. This sophisticated approach earns its place in the list of sales forecasting techniques because it offers the potential to significantly enhance accuracy, particularly in complex, multi-variable environments where traditional methods fall short.
Sales Forecasting Techniques Comparison
| Technique | Implementation Complexity 🔄 | Resource Requirements ⚡ | Expected Outcomes 📊 | Ideal Use Cases 💡 | Key Advantages ⭐ |
|---|---|---|---|---|---|
| Time Series Analysis | Moderate to High; requires statistical expertise | Moderate; mainly historical data | Accurate short-medium term forecasts with confidence intervals | Established businesses with 2+ years data, seasonal products, stable markets | Highly accurate for stable patterns, objective, identifies subtle trends |
| Pipeline Analysis | Moderate; depends on sales process definition and updates | Moderate; requires active sales pipeline management | Real-time revenue forecasts based on deal probabilities | B2B sales, high-value deals, complex sales cycles | Reflects current market conditions, pipeline visibility, proactive management |
| Moving Averages | Low; simple calculations | Low; minimal historical data | Smoothed trends, useful for short-term forecasting | Stable demand, quick trend identification | Simple, low resource, easy to understand and implement |
| Regression Analysis | High; statistical and data preparation skills needed | Moderate to High; multiple variables required | Quantitative insights on sales drivers, scenario testing | Sales influenced by multiple factors, marketing impact analysis | Multi-variable modeling, insightful cause-effect relationships |
| Bottom-Up Forecasting | High; coordination of many contributors | High; requires input from sales teams | Detailed and granular forecasts aggregated from individual units | Large organizations, diverse products, need for local insights | Leverages local knowledge, increases accountability, early risk spotting |
| Top-Down Forecasting | Moderate; relies on market research and strategic input | Moderate; market data and analysis resources | High-level, strategic forecasts broken down into segments | New market entry, strategic planning, mature markets | Maintains strategic alignment, faster than bottom-up, consistent methodology |
| Machine Learning & AI Forecasting | High; advanced data science and technical skills required | High; data infrastructure and expertise | Sophisticated, adaptive forecasts capturing complex patterns | Large data volumes, multi-variable environments, dynamic markets | Handles complexity, continuous learning, processes unstructured data |
Elevate Your Forecasting Game: Choosing the Right Technique
Mastering sales forecasting techniques is no longer a luxury, but a necessity for businesses of all sizes. From simple moving averages to the complexities of machine learning, the techniques covered in this article – time series analysis, pipeline analysis, regression analysis, bottom-up and top-down forecasting, and even cutting-edge AI – provide a powerful toolkit for predicting future sales. The key takeaway is that the most effective approach isn't about relying on a single method, but strategically combining these sales forecasting techniques based on your unique business context and available data. This understanding empowers you to make informed decisions, optimize resource allocation, and ultimately drive revenue growth. By accurately predicting future sales, you equip your business with the agility to navigate market fluctuations, capitalize on emerging opportunities, and confidently plan for a successful future.
Ready to supercharge your sales forecasting? Explore the power of AI with AIForExcel. AIForExcel streamlines complex calculations and data analysis for several forecasting methods discussed, allowing you to generate more accurate predictions and free up valuable time for strategic decision-making.