Data quality checks are essentially automated rules and procedures that act as your data's first line of defense. They are designed to rigorously test the accuracy, completeness, and consistency of the information flowing into your systems.
Think of it as a quality control assembly line for your data. Before any piece of information is used for analysis or reporting, it must pass a series of inspections to ensure it's reliable and fit for purpose.
Why Your Data's Trustworthiness Matters
Picture a master chef about to create a signature dish. What's the first thing they do? They inspect their ingredients. They check the freshness of the produce, the cut of the meat, and the purity of the spices. They know, from experience, that even the most brilliant recipe will fail if the core ingredients are bad.
Data quality checks play the same fundamental role in the world of business intelligence. If you feed your analytics systems with flawed data, you're guaranteed to get flawed insights and make misguided decisions. It's as simple as that.
In a business environment where being "data-driven" is the goal, a huge problem often gets overlooked: a deep-seated lack of trust. Companies are pouring money into advanced analytics tools, but many leaders and teams quietly harbor doubts about the data itself. This creates a risky situation where decisions are made based on information that might be incomplete, inconsistent, or just plain wrong. Proactive data quality checks are the only way to fix this.
The Critical Trust Gap in Modern Business
This isn't just some abstract concept—it's a real, measurable issue that holds businesses back. A recent global survey really put a spotlight on the problem. While a whopping 77% of professionals said making data-driven decisions was their top priority, only 46% actually had high trust in the data they were using.
What's causing this disconnect? The survey found that for 70% of those with low trust, the primary reason was poor data quality. You can dive deeper into these insights by reviewing the full report on 2024 data quality trends on Precisely.com.
This trust gap is more than just a statistic; it represents missed opportunities, inefficient operations, and flawed strategies. Without confidence in your data, your analytics become a liability instead of an asset.
When you put a solid system of data quality checks in place, you start to turn this uncertainty into a real advantage. You’re building an unshakable foundation of trust, making sure that every report, dashboard, and prediction is based on information you can truly stand behind. This guide will show you how to build that foundation and turn raw data into your most valuable asset.
Exploring the Six Dimensions of Quality Data
Before you can even begin to implement data quality checks, you need a solid framework for what "good" data actually looks like. Think of it less like a rigid process and more like a report card for your information. By grading your data against these six core dimensions, you can spot specific weaknesses and create targeted fixes. These dimensions aren't isolated; they all work together to give you a complete picture of your data's health.
The infographic below shows how these critical quality dimensions come together in a modern data environment.
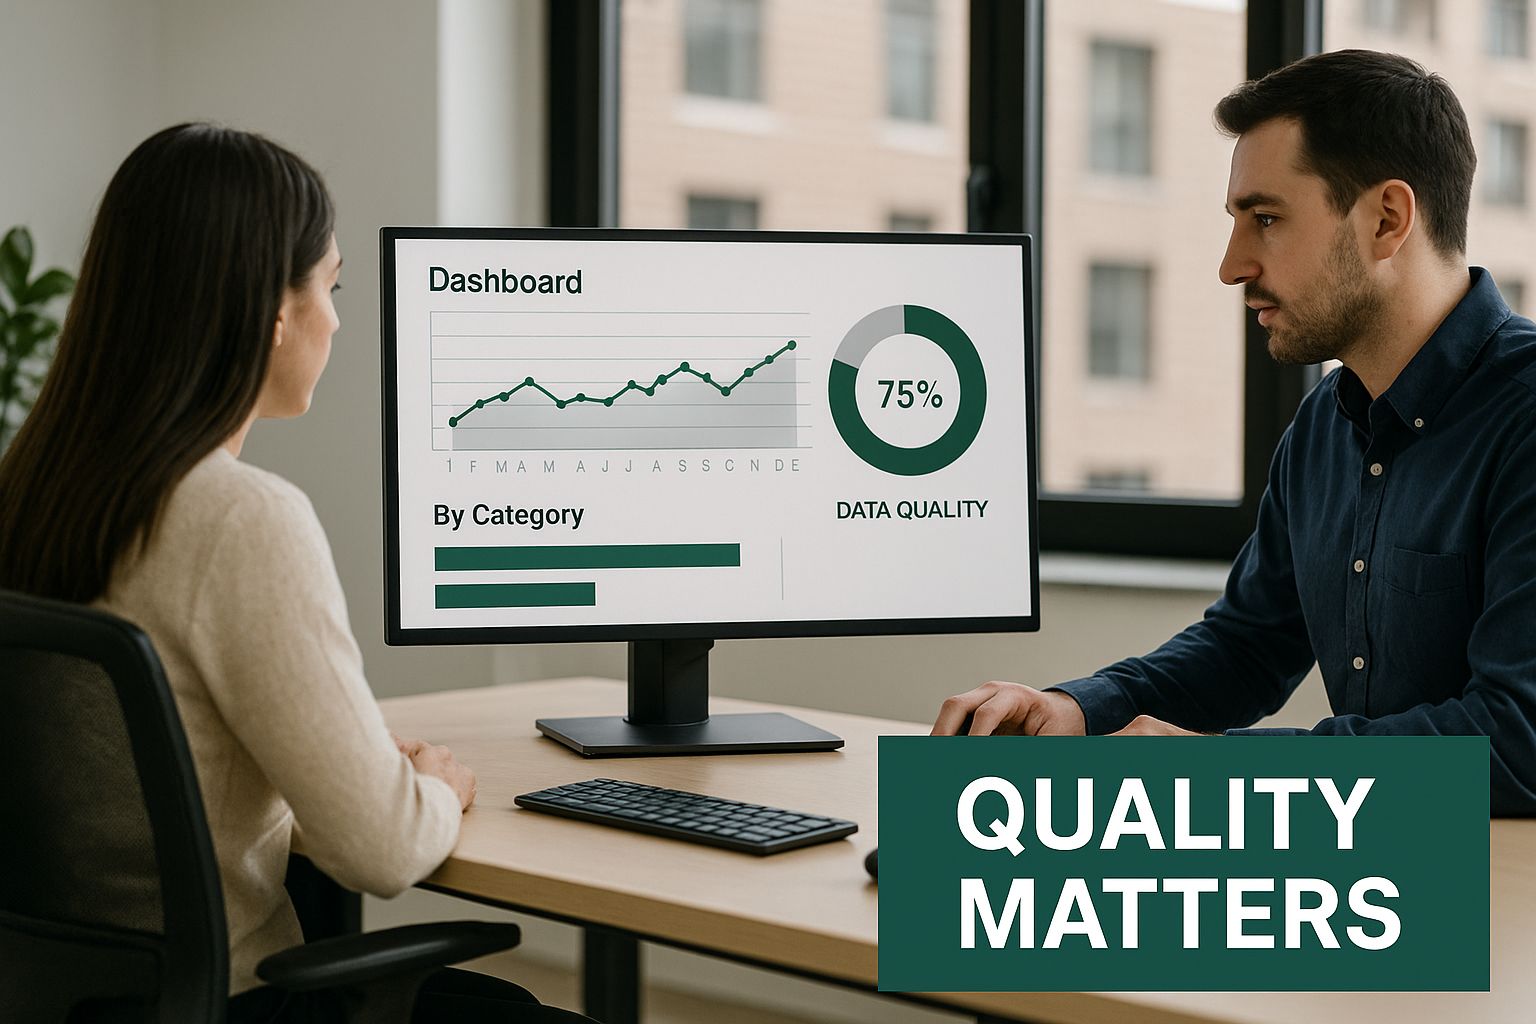
As you can see, for an analyst to pull any meaningful insight from a dashboard, the data underneath has to pass muster. It’s a powerful reminder that quality truly matters for every single business decision.
Accuracy and Completeness
Let's start with the most intuitive dimensions: accuracy and completeness.
Accuracy answers a very simple question: Does this data reflect the real world? An inaccurate address in your CRM means a package never arrives. A wrong price on an invoice sparks a frustrating customer dispute. Accuracy checks are all about making sure your data is a faithful representation of reality.
Completeness, on the other hand, measures whether all the critical data is actually there. Picture a new customer signup form where half the fields are left blank. That record is almost useless for targeted marketing or sales follow-up. A complete record has all the essential information you need to do your job.
Consistency and Timeliness
Next up are consistency and timeliness.
Consistency ensures that the same piece of information looks the same everywhere. If a customer is "John Smith" in your sales software but "Jon M. Smith" in your support tool, you’ve just created a data headache. These inconsistencies lead to duplicate records and a broken view of the customer journey, making it vital to maintain a single source of truth.
Timeliness is all about how current your data is. Financial data from last quarter is ancient history if you're trying to make real-time trading decisions. The key is ensuring data is available right when you need it. For example, inventory levels have to be updated instantly to stop you from selling products you don't actually have.
A common pitfall is obsessing over one or two dimensions, like accuracy, while letting others like timeliness or consistency slide. Real data quality happens when all six dimensions are in balance. A weakness in one can easily cancel out the strengths of the others.
Uniqueness and Validity
The final two dimensions, uniqueness and validity, bring another layer of polish to your data. They’re about eliminating clutter and enforcing the rules of the road.
Uniqueness: This is straightforward—no duplicate entries. When you have multiple identical records for the same customer or product, your analytics get skewed and you waste resources. Sending the same marketing email to a customer three times because of duplicates isn't just inefficient; it looks unprofessional.
Validity: This confirms that your data follows a specific format or rule. A valid email address has to look like
[email protected]. A product ID must match the format defined in your database. Validity checks are the gatekeepers that ensure data plays by the structural rules of your systems.
Putting Common Data Quality Checks into Practice
Knowing the theory behind data quality is one thing, but rolling up your sleeves and actually applying that knowledge is where the magic happens. This is the point where you stop talking about concepts and start implementing concrete data quality checks—the rules and procedures that actively defend your data's integrity. Think of it as moving from the blueprint to the construction site.
These checks are your first line of defense, like a series of automated inspections running 24/7. Each one is designed to spot a specific type of flaw, ensuring that only clean, reliable data moves through your systems and reaches the people who depend on it. This hands-on approach is how you turn messy, untrustworthy information into a valuable, strategic asset.
The Essential Validation Toolkit
So, what do these checks look like in the real world? Let's break down a few of the most fundamental validation techniques. These rule-based tests are the bread and butter of any good data quality strategy and are surprisingly powerful at catching everyday errors before they snowball into bigger problems.
Format Checks: This is about making sure data looks the way it's supposed to. For example, a system can check that every phone number follows a specific pattern, like
(###) ###-####. Anything that doesn't match, like "5551234567" or "N/A," gets flagged instantly for review.Range Checks: This check ensures a number falls within a logical, predefined boundary. Imagine you're analyzing customer demographics. A range check can verify that an age field is between 18 and 120, preventing a simple typo like "150" or a data entry error like "5" from corrupting your results.
Referential Integrity Checks: This is a crucial one for connected data. It verifies that relationships between tables make sense. For instance, it checks that a
customer_IDin yourorderstable actually corresponds to a real customer in your maincustomerstable. This prevents "orphaned" records—like sales tied to a ghost customer—from breaking your reports.
Finding these issues is the first step. For a closer look at how to fix what you find, you can dive into various data cleaning techniques that help you turn messy data into a clean, usable resource.
From Data Chaos to Usable Insight
To really appreciate the difference these checks make, let's walk through a quick before-and-after. Say you just imported a fresh list of sales leads into your CRM.
Before Checks: The raw file is a mess. It has a mix of 5-digit and 9-digit zip codes, order dates set two years in the future, and several customer IDs that don't match anyone in your existing database. Attempting to use this data would be a disaster, leading to bounced mail, skewed sales forecasts, and a marketing campaign aimed at non-existent people.
Now, let's see what happens when you run that same file through your quality checks.
After Checks: The format check automatically standardizes all zip codes to the correct 5-digit format. The range check catches the impossible future dates and holds them for someone to review. And the referential integrity check flags every order tied to a bad customer ID, preventing them from corrupting your system until the records are fixed.
Suddenly, chaos becomes order. The result is a clean, trustworthy dataset you can actually use to make smart business decisions.
Building a Modern Data Quality Framework
Technology has completely changed how we handle data quality checks. We're moving away from the old, manual methods that felt like a chore and embracing a more proactive, automated approach.
Think about the traditional way: running checks on data batches after they've already been processed. It’s a lot like watching security footage after a robbery. You can see what went wrong, but the damage is already done. This reactive model just can't keep up anymore.
The modern approach, however, acts more like a sophisticated, always-on security system for your data. It uses smart tools to monitor information as it flows, alerting you the second something looks off. This stops bad data in its tracks before it can ever infect your critical systems.
This shift is largely thanks to big strides in artificial intelligence and machine learning. These technologies can perform complex data quality checks that are light-years ahead of simple, rule-based validation.
The Rise of AI in Data Quality
AI-powered systems are incredibly good at catching the subtle patterns and outliers that older methods would almost certainly miss. For instance, imagine trying to write a rule for every possible typo of "New York City." It’s nearly impossible. An AI model, on the other hand, understands context and can flag "New Yrok" as a likely mistake without needing a specific rule for it.
The efficiency gains here are massive. In fact, AI-powered data cleansing can cut the time it takes to set up and deploy quality solutions by up to 90%. Even better, predictive analytics can help organizations spot potential data problems before they happen. This turns quality assurance from a reactive cleanup crew into a proactive strategy. If you want to dive deeper into this evolution, check out the latest data quality trends from Qualytics.ai.
This leap forward has a direct impact on how fast a business can move. When you have full confidence in your data streams in real time, you can make decisions quicker and with more certainty.
A modern data quality framework is built on the principle of prevention over cure. It stops data issues at the source, before they can poison downstream analytics, corrupt reports, and erode trust in your business intelligence.
Key Components of a Modern Framework
So, what does it take to build this kind of framework? It really comes down to integrating a few core capabilities directly into your data pipelines:
- Automated Anomaly Detection: These are systems that learn what "normal" looks like for your data and automatically flag anything that deviates, all without needing you to write a bunch of rules.
- Real-Time Monitoring and Alerting: Think dashboards and instant notifications that give you a live view of your data's health. This allows teams to jump on issues in minutes, not days or weeks.
- Predictive Quality Scoring: These are models that can actually score a dataset's risk of having quality problems, helping you focus your cleanup efforts where they'll have the biggest impact.
- Embedded Quality Gates: This means building data quality checks right into your data ingestion and transformation workflows. Bad data gets automatically quarantined or fixed before it can move any further down the line.
By embracing these modern practices, organizations drastically shorten the time it takes to get from raw data to valuable insight. More importantly, they ensure that every business decision is built on a solid foundation of trustworthy, high-quality data. It’s not just an incremental improvement; it’s a fundamental rethinking of how to manage information as a crucial strategic asset.
Choosing the Right Data Quality Tools

Once you've got a solid data quality strategy on paper, the next step is bringing it to life with the right tools. The market is packed with options, ranging from powerful open-source libraries to full-blown enterprise platforms. The key is to find the one that fits your company's specific needs, technical skills, and budget.
Think about it like choosing a vehicle for a business. A small local shop might just need a reliable scooter (like a simple script) for quick deliveries. But a massive logistics company? They're going to need a whole fleet of semi-trucks (an enterprise platform) complete with sophisticated tracking systems. There’s no single "best" tool—only the best fit for the job at hand.
Finding the Right Tool for Your Team
To pick the right tool, you first need to understand the main categories out there. Each approach has its own set of pros and cons that cater to different teams and business goals.
Let's break down the landscape of data quality tools to help you see where your organization might fit in.
A Comparison of Data Quality Tools
| Tool Category | Best For | Key Features | Considerations |
|---|---|---|---|
| Open-Source & Custom Scripts | Teams with strong in-house engineering talent and highly specific needs. | Maximum flexibility and control; build bespoke checks tailored to your exact data. | Requires significant development time and ongoing maintenance. High initial effort. |
| Integrated Platform Modules | Organizations looking for convenience and a unified workflow within their existing data stack. | Seamless integration with data warehouses or ETL tools; good for basic checks. | May lack the depth and advanced features of a specialized, standalone tool. |
| Dedicated Enterprise Platforms | Larger organizations needing a comprehensive, scalable, and user-friendly solution. | Automated monitoring, intuitive dashboards, powerful reporting, and collaborative features. | Represents a higher financial investment and requires more organizational buy-in. |
Ultimately, the goal is to balance power, cost, and usability. The Houston transportation data management experience is a great real-world example of why this matters. Even with rigorous checks in place, they found that subtle inaccuracies slipped through because of how they sourced and validated their data. This underscores the need for a tool that not only performs checks but fits your entire data lifecycle.
The right tool should not only solve today's problems but also scale with you as your business and its data needs grow. A powerful tool often generates complex reports, so presenting those findings clearly is crucial. You can learn more by reading our guide on data visualization best practices.
Creating a Sustainable Data Quality Culture
Let's be honest: tools and automated frameworks are crucial for running data quality checks, but they only get you so far. If you want lasting success, you have to build a company-wide culture that treats data as a core product, not just a by-product of doing business. This means moving away from frantic, one-off cleanup projects and embracing a mindset of continuous improvement.
This kind of cultural shift starts with a simple, powerful question: when data goes wrong, whose job is it to fix it? If no one knows the answer, problems will fester. That’s why establishing clear data ownership is your first real step. You assign specific teams or individuals the responsibility for the quality of their data domains. For example, your sales team owns the accuracy of its CRM data, and the finance team is on the hook for its transactional records. No more finger-pointing.
Establishing a Single Source of Truth
Once ownership is clear, the next hurdle is getting everyone on the same page. This is where a centralized data dictionary becomes your best friend. Think of it as a universal Rosetta Stone for your organization. It defines every single metric, field, and term in plain language.
This simple document ensures that when the marketing team talks about "active users" and the product team talks about "active users," they actually mean the same thing. This shared understanding builds trust, smooths out collaboration, and makes every insight that much more reliable.
True data quality isn't just about clean datasets; it's about creating a shared organizational discipline. The goal is to make good data hygiene an automatic, ingrained habit for everyone who touches the data.
Embedding Quality into Daily Workflows
The most effective data quality checks are the ones that happen automatically. By building validation rules directly into your data pipelines, you create quality gates that work behind the scenes. This means bad data gets flagged and stopped the moment it tries to enter your system, not weeks later when it derails a critical report.
Finally, you need to empower your team to be your eyes and ears on the ground. Make it easy for them to become part of the solution by creating simple feedback loops.
Here’s a practical approach:
- Easy Reporting: Give users a simple way to flag an issue they spot, like a "Report Error" button right on their dashboard.
- Clear Routing: Make sure those reports are automatically sent to the correct data owner, so nothing falls through the cracks.
- Visible Progress: Show people that their feedback is being heard and acted upon. This visibility is what encourages them to keep participating.
Building this kind of culture is a marathon, not a sprint. But the payoff is huge: it turns data quality from a niche technical task into a shared business responsibility. Many organizations use a variety of free data analysis tools to help build out these reporting and feedback processes, ensuring data reliability for the long haul.
Answering Your Top Data Quality Questions
As you start to get serious about data quality, a few practical questions almost always pop up. Let's walk through some of the most common ones I hear from teams who are putting these checks into practice.
How Often Should We Run Data Quality Checks?
There's no single right answer here—it really comes down to how quickly your data changes and how much that data matters to your business operations.
Think of it this way: for something as critical as real-time inventory levels or live financial transactions, you need to know about problems immediately. In these cases, checks should run in real-time or near real-time. But for something like a monthly marketing report, running checks daily or even weekly is probably fine. The goal is to match the check frequency to the "freshness" of the data and the risk you're taking by using it.
Who Is Responsible for Data Quality?
This is a big one. While it's tempting to point to the IT department or a specialized data team, the truth is that data quality is a team sport. It's a shared responsibility that spans the entire organization.
Business users are usually the first ones to notice when the numbers just don't "feel right." They are your front line. Data owners, on the other hand, are the ones who should define the business rules and standards. IT's job is to provide the technical muscle—the infrastructure and tools to run those checks automatically. Great data quality only happens when all three groups are working together.
What Is the Difference Between Data Cleaning and Data Quality?
It's easy to get these two mixed up, but they are distinct, sequential steps.
- Data Quality Checks are like the diagnostic tests a doctor runs. They are all about identifying, measuring, and keeping an eye on problems in your data based on the rules you’ve set.
- Data Cleaning (also called data cleansing) is the treatment that follows the diagnosis. It’s the hands-on process of actually fixing the errors, filling in the gaps, and correcting the inconsistencies that your quality checks flagged.
You can’t have one without the other. Data quality checks tell you what's broken, and data cleaning is how you fix it. You need solid checks first, so you know exactly what needs your attention.
Tired of wrestling with complex formulas just to get your data in shape? AIForExcel brings a conversational AI assistant right into your spreadsheet, letting you clean, analyze, and manage your data simply by asking questions in plain English. Spend less time on manual tasks and more time on insights. Explore how AIForExcel can transform your workflow.