Why Most QBRs Feel Like Root Canal Procedures
Let's be honest, nobody likes QBRs. If your team groans when QBR season rolls around, you're not alone. I've chatted with plenty of executives who feel their quarterly reviews are more like painful endurance tests than productive strategy sessions. Often, the unfortunate symbol of these unproductive meetings? Dense, unread PowerPoint decks. These meetings, meant to propel the business forward, become a huge drain on time and resources.
One of the biggest offenders is the "death-by-data-dump." Instead of insightful narratives, stakeholders get bombarded with raw numbers that lack context. This information overload just makes everyone's eyes glaze over, preventing any real discussion or decision-making. The sheer volume of data obscures the important takeaways, making it hard to see key trends and actionable insights. Remember, the point isn’t to show off your meticulous record-keeping; it's about using that data to make smart decisions.
The reason for this disengagement is simple: our brains are wired for stories, not just spreadsheets. A well-structured quarterly business review template provides the framework for that story. It guides stakeholders through a clear narrative of performance, challenges, and future direction. Without this structure, the meeting becomes a chaotic mess, leaving everyone feeling lost and frustrated. A good template makes sure everyone's on the same page, focused on shared goals, and actively involved.
And think about the hidden costs of disorganized reviews. These go way beyond just wasted meeting time. Consider the missed chances to spot emerging trends, tackle critical challenges, and align teams around key priorities. A poorly executed QBR can throw your strategy off track, slowing down progress and affecting overall business performance.
On the other hand, a structured, data-driven approach can have a huge impact. For example, a 2024 survey by the management platform Tability found that companies using data-driven QBRs saw a 23% improvement in achieving their quarterly objectives. That's a big deal! Check out the full survey here. The right template isn’t just about making things look pretty; it’s the foundation for decisions that actually make a difference.
The key to transforming your QBRs is to shift the focus from simply presenting data to having a real strategic conversation. This means rethinking how you structure your reviews, what information you share, and how you engage your stakeholders. In the following sections, we'll dive into specific strategies for designing QBRs that spark real discussions and drive meaningful action.
Setting Up Excel Like You Actually Know What You're Doing
Forget those sprawling, overwhelming Excel templates that look like they were built by a spreadsheet wizard. We're going to create a quarterly business review (QBR) template in Excel that your team will actually find useful. The key? Smart organization. Think of your workbook like a well-organized office. You wouldn't just toss files randomly on the floor, right? The same principle applies here. Clear file names and a logical structure are crucial. Trust me, future-you will be incredibly grateful when you can quickly locate exactly what you need six months down the line. This sets the stage for a smooth and efficient QBR process.
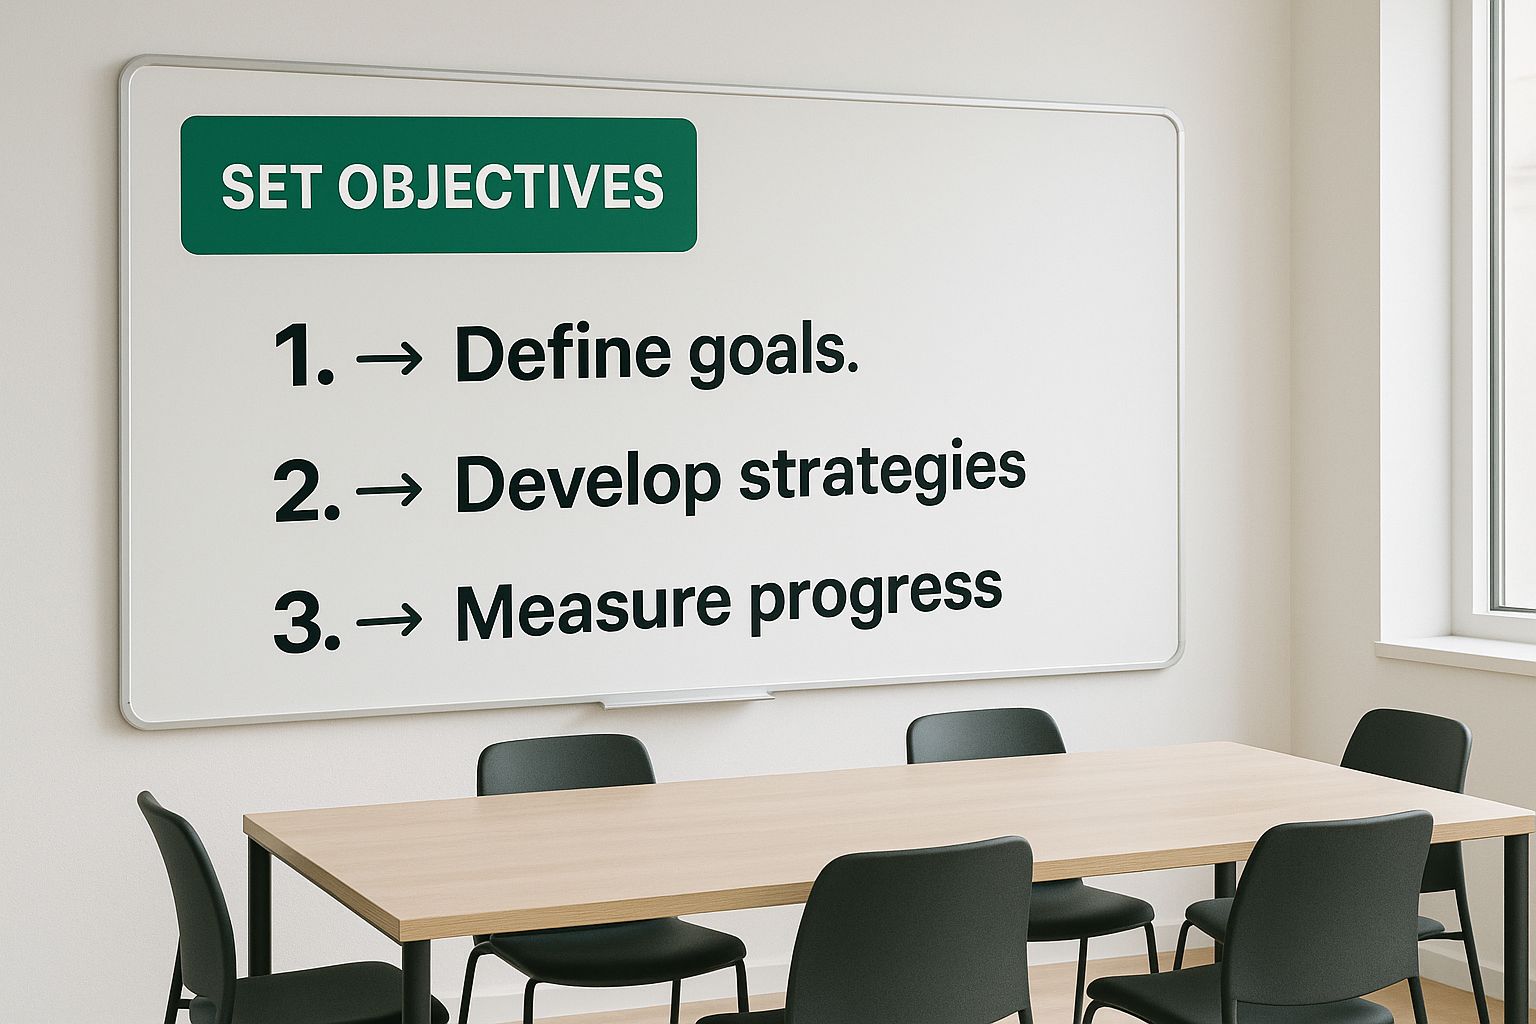 This infographic visualizes the initial stage of a quarterly business review, emphasizing the importance of setting clear objectives from the outset.
The infographic's emphasis on "Set Objectives" within a collaborative workspace really highlights the importance of initial planning and agreement. Getting everyone on the same page from the start is essential for a productive QBR process. This sets the foundation for everything that follows.
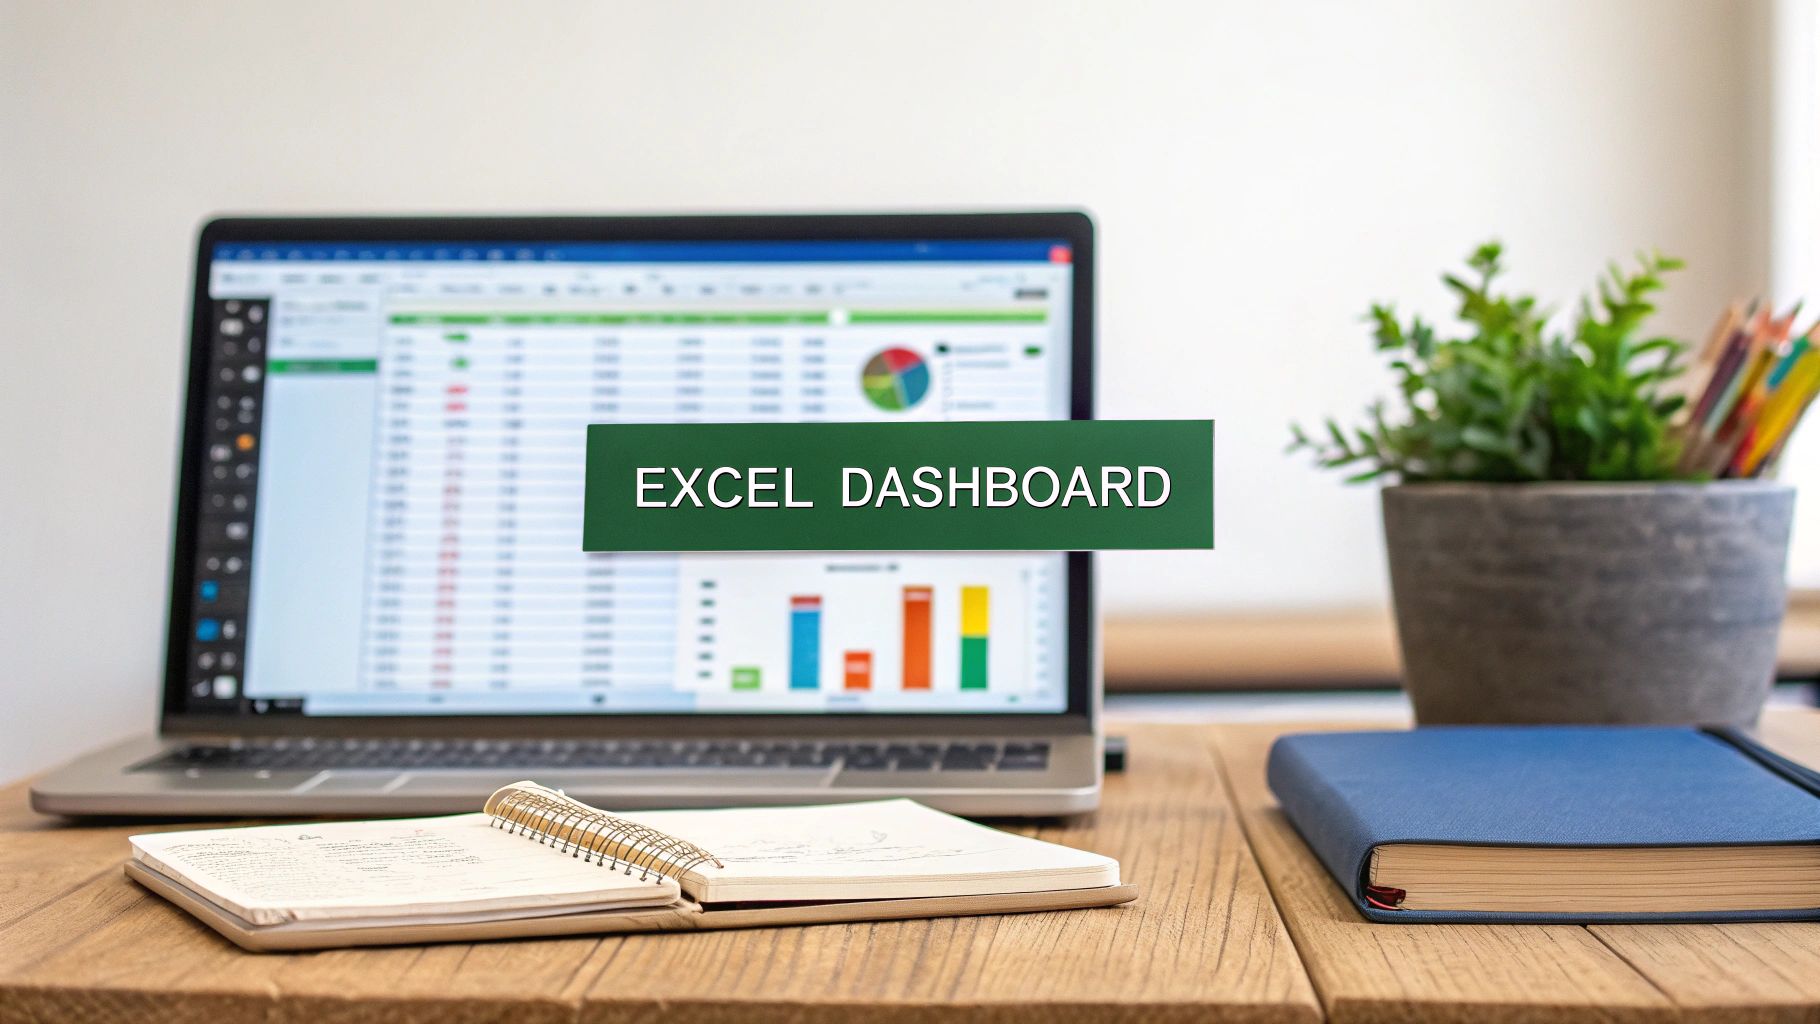
Now, let’s talk dashboards. These aren't just for showcasing fancy charts (although, let's be honest, that's a definite perk). A well-designed dashboard uses your data to tell a compelling story, revealing key trends and insights at a glance. Think of it as the executive summary of your quarterly performance. It makes it easy for even the busiest stakeholders to quickly grasp the main takeaways. With AIForExcel, you can automate calculations, which eliminates manual errors and frees up your time for more in-depth analysis.
Leveraging Excel's Power Features
Beyond basic formulas, Excel offers some seriously powerful features that can transform your QBR template. Consider conditional formatting to visually highlight key performance indicators (KPIs), data validation to ensure data accuracy, and pivot tables to analyze your data from different angles. These aren't just abstract Excel tricks; they become incredibly practical and useful in the context of quarterly reviews.
To help you see how these features can be used in your QBR template, let's take a look at the following table. It breaks down some essential Excel features and their specific applications, as well as how difficult they are to implement and their overall impact on your efficiency.
| Excel Feature | QBR Application | Difficulty Level | Impact on Efficiency |
|---|---|---|---|
| Conditional Formatting | Highlight KPIs exceeding targets or falling below thresholds | Beginner | High - Quickly identifies areas needing attention |
| Data Validation | Ensure data consistency and accuracy in input fields (e.g., dates, percentages) | Beginner | Medium - Prevents errors and improves data quality |
| Pivot Tables | Summarize and analyze large datasets by different criteria (e.g., sales by region, product performance over time) | Intermediate | High - Facilitates in-depth analysis and trend identification |
| Charts & Graphs | Visualize key data points and trends for clear communication of performance | Beginner | High - Improves data comprehension and presentation |
| Formulas & Functions | Automate calculations (e.g., calculating growth rates, totals) | Beginner to Advanced | High - Saves time and reduces manual errors |
As you can see, even seemingly simple features like conditional formatting can have a huge impact on how quickly you can identify areas needing attention during your QBR. And while pivot tables might seem a bit more daunting at first, the ability to easily summarize and analyze large datasets is invaluable.
For more in-depth information about data analysis in Excel, check out our guide on Data Analysis in Excel.
Finally, let's talk visuals. You don't have to be a graphic designer to create a visually appealing template. Simple design choices can make a world of difference in terms of readability and engagement. A clean layout, clear headings, and the strategic use of white space can guide your audience through the data effortlessly, turning your QBR from a dry data dump into a compelling and informative story.
Designing Sections That Spark Real Conversations
Your quarterly business review (QBR) template shouldn't just be a data dump. It needs to be a launchpad for real discussion and strategic thinking. I've seen firsthand how powerful a well-structured QBR can be, and I’m going to share some insights on designing sections that actually get people talking and, more importantly, doing. A well-structured quarterly business review template facilitates these conversations, providing a roadmap for productive discussions.
Crafting an Executive Summary That Grabs Attention
The executive summary is prime real estate. It's often the first (and sometimes only) thing busy stakeholders will read. Instead of a boring recap of the quarter, think of your executive summary as a highlight reel. Grab their attention from the get-go. Showcase key wins, address challenges head-on, and outline upcoming priorities with impact. Think of it like a movie trailer – pique interest and leave them wanting more. For example, instead of "Sales were up 5%," try something like, "We crushed our sales targets by 5% this quarter, fueled by the successful launch of our new product line." Context is key.
KPI Dashboards: Show the Story, Not Just the Numbers
KPI dashboards shouldn't just be a wall of numbers. They need to tell a story. Use visuals that clearly communicate performance against targets and uncover hidden trends. A splash of color-coding can work wonders, highlighting areas that need immediate attention. Think red for KPIs below target and green for those exceeding it. This helps stakeholders quickly grasp the big picture and zero in on discussion points. Speaking of big picture, did you know that QBRs are now a standard practice for over 70% of Fortune 500 companies, according to recent industry surveys? They're a powerful tool for performance evaluation and strategic alignment. Want to dive deeper into the world of QBRs? Check out this resource.
Action Planning: From Promises to Progress
The action planning section is where the rubber meets the road. This is where your QBR goes from analysis to action. This section needs to ensure follow-through, not just forgotten promises. Clearly define specific actions, assign owners, and set realistic deadlines. Be precise. Instead of "Improve customer satisfaction," try, "Implement a new customer feedback survey by the end of Q3, led by the Customer Success team." That level of detail keeps everyone accountable and ensures your QBR translates into real results.
Structuring Key Sections for Maximum Impact
Now, let's talk about the core sections of your QBR: financial performance, operational metrics, customer insights, and market analysis. How can we structure these to spark conversations that lead to real change? For financials, don't just present the numbers. Explain the why behind them. What drove the results? Where are the areas for growth? This encourages a deeper dive and a more strategic discussion. For customer insights, bring in the voice of the customer. What are their pain points? What do they need? This helps align your strategy with customer expectations and leads to more customer-centric decisions. By structuring each section to promote insightful discussion, your QBR transforms from a reporting exercise into a strategic planning session that drives real growth.

Making Data Tell Stories People Actually Remember
Raw numbers can be a real headache. They're like a pile of Lego bricks without instructions – a bunch of pieces, but no clear picture of what they're supposed to build. That’s where data visualization comes in. A thoughtfully chosen chart in your quarterly business review (QBR) template can transform that pile of bricks into a sleek, finished Lego masterpiece.
It's not about making things "look pretty" (though that’s a bonus!). It's about communicating effectively. Just like choosing the right words to tell a story, you need to pick the right chart to convey your data’s message. A pie chart is great for market share, but a line graph is better for showing trends. It’s all about picking the right tool for the job.
Choosing the Right Visuals for Your Story
So, how do you choose the right chart? Start by thinking about the narrative you want to tell. Are you demonstrating progress toward a specific goal? A bar chart might be perfect. Trying to highlight the relationship between two different data points? A scatter plot could be more effective.
Think about your audience too. What kind of charts will resonate with them? What will help them quickly grasp the key takeaways? This targeted approach is what makes a QBR engaging and effective. If you're dealing with particularly complex analysis, consider exploring tools like AI for Excel which can provide extra support.
Using Color Psychology to Guide Attention
Color is more than just decoration – it's a powerful tool for communication. Use it strategically to direct your audience's focus. Highlight important data points with contrasting colors to make them pop. Consider using cool blues to represent stability, vibrant greens for growth, or attention-grabbing reds to flag areas needing improvement.
These color choices subtly influence how people perceive your data, reinforcing your overall message and making it stick. It's like using bold text for emphasis in a written document.
Trend Analysis, Comparisons, and Predictions
The best business leaders don't just present data, they weave a story around it. They use trend analysis to illustrate how performance has changed, comparative visualizations to benchmark against competitors (or past performance), and predictive indicators to anticipate future opportunities and challenges. Think of it as adding context and insight to your data.
This forward-thinking approach transforms a static QBR into a dynamic discussion about the past, present, and future of the business. This is essential for strategic planning and informed decision-making. It’s interesting to note that the use of customizable digital quarterly business review templates has grown significantly, with a 45% increase globally since 2020 according to a 2025 Wallaroo Media industry report. This shows a clear shift towards more efficient review processes. You can learn more about this trend in the Wallaroo QBR guide.
Let's talk about data visualization best practices. I've put together a table to help you select the best charts and visualizations for different kinds of data in your QBR:
QBR Data Visualization Best Practices
Guide to selecting appropriate chart types and visualization methods for different types of quarterly business data
| Data Type | Recommended Chart | Key Benefits | Common Mistakes to Avoid |
|---|---|---|---|
| Sales Performance | Line Graph | Visualizes trends and progress over time. | Using a pie chart, obscuring trends. |
| Market Share | Pie Chart | Clearly shows proportions and relative contribution. | Using too many segments, making it cluttered. |
| Customer Churn | Bar Chart | Compares churn rates across different periods. | Not labeling axes clearly. |
| Website Traffic | Area Chart | Shows the volume of traffic over time. | Using 3D effects, distorting data. |
| Budget vs. Actual | Combo Chart | Displays both budget and actual figures for comparison. | Overcomplicating the chart, confusing viewers. |
This table provides a quick guide to help you match the right chart to your data type, highlighting the benefits and pitfalls to watch out for.
Interactive Elements and Engagement
Finally, don't shy away from interactive elements in your Excel dashboards. Think drop-down menus, clickable charts, and dynamic filters – anything that encourages exploration and keeps your audience engaged.
These features empower stakeholders to dive deeper into the data, fostering a sense of ownership and understanding. It's like turning a lecture into a workshop. The QBR becomes less of a passive presentation and more of an active dialogue, leading to richer insights and more effective decisions.
Automation Hacks That Give You Your Life Back

Let's be honest, nobody enjoys spending weeks prepping for Quarterly Business Reviews (QBRs). You should be analyzing results and strategizing, not drowning in spreadsheets. I’ve been there, trust me. Let's talk about some automation tricks that can cut your QBR prep time in half and make your quarterly business review template shine.
One of the biggest time-wasters is manually pulling data. Instead of endless copy-pasting, set up automatic data connections right in your Excel workbook. This pulls information directly from your CRM, marketing automation platform, or financial software, updating your quarterly business review template dynamically. Imagine: real-time KPI updates with zero effort.
Formulas are your secret weapon. Don't just calculate KPIs once; build formulas that automatically recalculate as new data flows in. This not only saves time but also minimizes errors. Pro tip: use dynamic charts linked to these live data feeds. As your data updates, so do your charts, creating a truly dynamic quarterly business review template.
Unleashing the Power of Excel and AIForExcel
Don't shy away from Excel's advanced features. Macros can automate repetitive tasks, and Power Query can transform and clean data from multiple sources in a few clicks. You don't need to be a coding expert – plenty of online resources can help you master these tools.
This is where AIForExcel truly changes the game. Integrating AIForExcel with your quarterly business review template takes your automation to the next level. You can use natural language to query your data, generate insights, and even create custom reports – all within Excel. This is invaluable when tailoring your QBR for different audiences. No more starting from scratch every time – just a few tweaks, and your template is ready. AIForExcel is like your personal Excel assistant, handling the tedious work so you can focus on strategy.
Think bigger than just Excel. Connect your QBR template with other tools. For instance, linking to your project management platform can automatically pull in progress updates. Connecting to your CRM can provide live customer data, adding valuable insights to your QBR. These integrations are often surprisingly easy to set up and add serious depth to your reviews. It’s a game-changer for creating a quarterly business review template that truly scales.
By using these automation hacks, you can reclaim your time and energy. QBR prep shouldn’t be a nightmare. It should be a streamlined process that lets you focus on the big picture. With the right tools and techniques, it absolutely can be.
Turning QBRs Into Decision-Making Powerhouses
A killer quarterly business review template is worthless if it doesn't help you make smart decisions and take real action. I've seen so many gorgeous templates get ignored because they missed the most important part: the human element. QBRs aren't about showing off data; they're about having conversations that push your business forward.
It's a common trap to treat QBRs like a massive data dump. Instead, think of your quarterly business review template as the starting point for a productive conversation. It should guide your team through a valuable discussion about performance, what's been tough, and what you're planning for the future. That means creating sections designed for strategic talk, not just charts and graphs.
Building Accountability Into Your Template
One of the most effective things you can do is bake accountability right into the template. Build specific sections for action planning, clearly listing tasks, assigning owners, and setting due dates. This takes your QBR from vague ideas to concrete commitments. When everyone knows who owns what and when it's due, things actually happen. This is essential for a quarterly business review template that actually gets results.
This screenshot shows the interface of Microsoft Excel, a powerful tool for creating and managing QBR templates.
The familiar layout of Excel, as you can see in the screenshot, shows how accessible it is for creating a solid, user-friendly quarterly business review template. Because it’s so widely used and has such powerful features, Excel is a great platform for managing the complexities of a QBR. Want to get deeper into creating effective KPI dashboards in Excel? We have a guide for that: Creating Powerful KPI Dashboards in Excel.
Fostering Strategic Conversations, Not Just Data Points
Think about your financial performance section. Instead of just displaying numbers, explain the why behind them. What drove those results? Where are the biggest growth opportunities? This encourages deeper thinking and more strategic discussion. The same idea applies to customer insights. Include the voice of the customer. What are their pain points? What needs aren't being met? This helps you build strategies that actually address what your customers want.
Linking Past Performance to Future Priorities
Another key piece is connecting current performance to future strategic priorities. A good QBR template provides a way to track progress on initiatives from the previous quarter and link those results to your goals for the next one. This creates momentum and makes sure your QBRs contribute to long-term success, not just short-term wins. This constant improvement cycle transforms QBRs from boring reports into drivers of strategic growth. It's about making sure everyone sees how their work contributes to the bigger picture and how today's performance shapes tomorrow's wins. By connecting past, present, and future, your QBRs become a roadmap for hitting those long-term goals.
Your Roadmap to QBR Success
Turning your quarterly business reviews from a dreaded chore into a powerful strategic tool takes more than just a fancy new quarterly business review template. You need a solid plan. Think of it like launching a new product – you wouldn't just put it out there without a marketing strategy, right? This section offers a practical roadmap for rolling out your new QBR approach, making sure it's adopted smoothly and has maximum impact.
Change Management: Getting Everyone On Board
Rolling out a new QBR process often means changing mindsets and working habits. Don't underestimate the importance of change management. Instead of forcing a new template on your team, involve them in the process. Ask for their input on what works, what doesn't, and how the new template can best support their needs. This builds buy-in and makes the transition way smoother. Aim for enthusiastic adoption, not grudging compliance.
Customization and Consistency: Finding the Right Balance
A good quarterly business review template offers a consistent framework, but it also needs to be flexible enough for different audiences. You wouldn’t use the same presentation for the C-suite and the marketing team, would you? Learn how to tailor your template to specific needs while keeping the core structure intact. This makes it relevant while maintaining a consistent brand and message.
Establishing a Sustainable QBR Rhythm
Realistically, schedules can get messy. The key is to establish a review cadence that actually works for your team. Don't try to force a rigid schedule if it clashes with other important things. Experiment to find a rhythm that fits your workflow and gives you enough time for prep and follow-up. This could mean tweaking the frequency or timing of your reviews depending on project cycles or business needs.
Continuous Improvement: The Key to Long-Term Success
Your QBR process isn't static. It needs to evolve over time based on feedback and results. Regularly check in with your team. What's working well? What are the pain points? Use this feedback to refine your template, tweak your approach, and constantly improve the effectiveness of your QBRs. This iterative approach ensures your reviews stay relevant and valuable in the long run.
Troubleshooting and Scaling: Anticipating Future Challenges
As your organization grows, your QBR process needs to grow with it. Think about how you can adapt your quarterly business review template for new teams or business units without sacrificing the personal touch that makes them effective. Be prepared for common bumps in the road, too. Having a plan for handling technical issues or addressing resistance to change can save you time and headaches later on.
By focusing on these key implementation aspects, you’re setting yourself up for QBR success. Your reviews will become less of a burden and more of a valuable tool for driving growth and reaching your strategic goals.
Ready to supercharge your Excel spreadsheets with AI? Check out AIForExcel and see how it can improve your QBR process.