Let's be honest, the biggest reason to get a handle on automating your Excel reports isn't just about clawing back a few hours. It’s about sidestepping the hidden dangers that come with doing things by hand. The whole idea is to use powerful, built-in tools like Power Query to wrestle your data into shape and VBA macros to handle the custom formatting and sending, effectively boiling down hours of tedious work into a single click.
The Real Price of Manual Excel Reporting
When you're stuck spending hours every week—or even every day—copying, pasting, and wrangling data, the most obvious cost is your time. But the real damage from manual reporting goes way deeper, poisoning everything from your data's reliability to your ability to react quickly. Sticking with those old, manual habits creates subtle drains on productivity and opens the door to risks many businesses don't even see until a major mistake happens.
Every single manual touchpoint is a potential pitfall. A simple copy-paste error, a fat-fingered number, or a column that doesn’t quite line up can send ripples of bad data through an entire report, leading to completely flawed conclusions. It's these tiny, seemingly innocent mistakes that can lead to disastrous business decisions, costing you far more than the time it took to build the report in the first place.
It's More Than Saving Time—It's a Strategic Edge
Too often, the conversation about automation stalls at "efficiency." But its true power is strategic. When you free up your team from the soul-crushing grind of manual data entry, they can finally shift their focus from data prep to data analysis.
That's a massive distinction. Instead of just assembling the report, they can actually dig in, interpret what it's saying, spot emerging trends, and deliver the kind of actionable insights that actually move the needle. This simple shift transforms your reporting from a backward-looking chore into a forward-looking strategic weapon.
The greatest risk of manual reporting isn't the hours you lose; it's the critical insights you miss while you're bogged down in the process. Automation gives you back your most valuable asset: the mental space to think deeply about what the data is telling you.
The Impact on Your Bottom Line and Operations
Moving to automation isn't just a nice-to-have improvement; it delivers a clear financial return. By 2024, roughly 60% of companies had already adopted some form of automation, and many of them saw an average 22% cut in their operating costs.
Some tools, like Robotic Process Automation (RPA)—a core method for automating Excel tasks—can produce an ROI between 30% and 200% within the very first year. But here’s the reality check: success isn't a given. Around 70% of digital transformation projects fall short of their goals. For Excel automation, this just underscores the need for a smart plan. It’s not just about buying new software; it's about rethinking your workflows and investing in training your people. You can discover more insights about automation industry data and see what it could mean for your own business.
Building a Bulletproof Automation Foundation
Before you even think about recording a macro or firing up Power Query, you need to lay some solid groundwork. I’ve seen it countless times: people jump straight into the tech, trying to automate a messy, inconsistent process. It’s like building a house on a foundation of sand—it’s just going to crumble.
The real secret to successful Excel automation isn't about fancy code; it's about standardizing your entire workflow before you touch any automation tools.
Think like an automator for a moment. You need to map out the entire journey your data takes. Where does it come from? What exact steps do you take to clean and shape it? And what, precisely, does the final report need to look like? Answering these questions now will save you countless headaches down the road.
This visual shows what I mean—getting your process and tools in order first is what makes the actual automation part go smoothly.
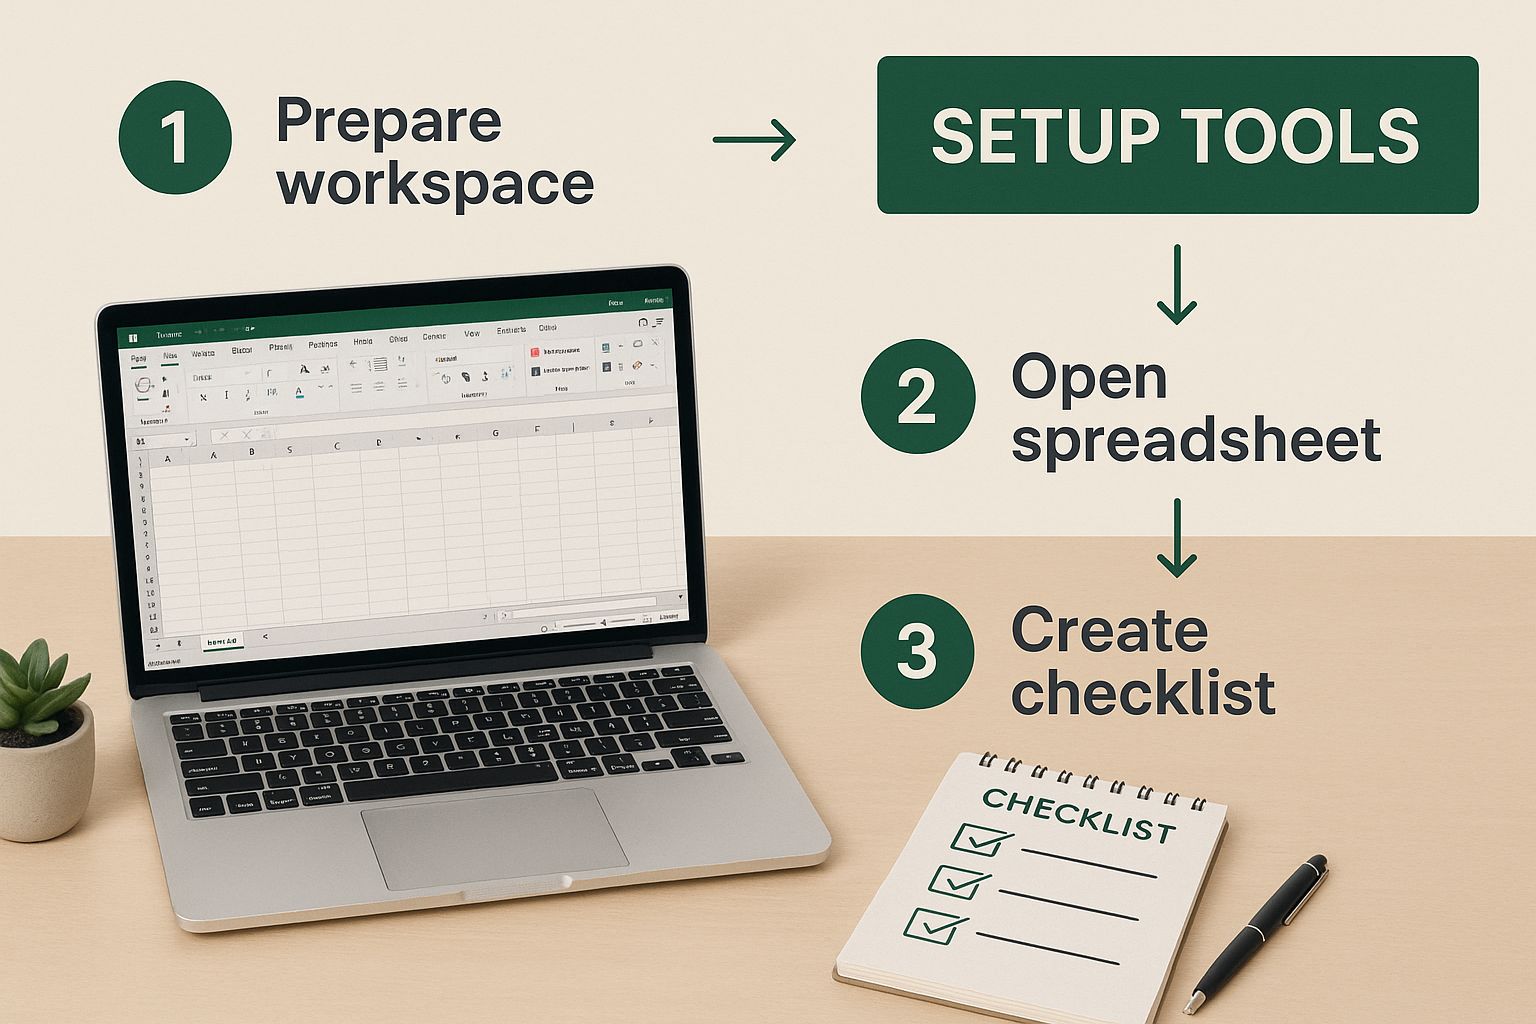
As you can see, auditing your current workflow isn't just a suggestion; it's the critical first step before you get into the technical weeds.
Mastering Your Data Hygiene
Here’s a hard truth: your automation is only as good as the data you feed it. In my experience, inconsistent data is the #1 reason automated reports fail. To build something that lasts, you have to enforce strict data hygiene.
Start by tackling the most common things that break automation:
- Standardize Date Formats: Make sure every single date is in one consistent format, like YYYY-MM-DD. When your data has a mix of "Jan 5, 2024" and "01/05/2024," your automated sorting and filtering will inevitably fail.
- Purge Duplicates: Duplicate entries are silent killers for your metrics, throwing off totals and averages. Your first data-cleaning step should always be a reliable process to find and remove them.
- Structure with Excel Tables: Stop working with loose ranges of cells. Get into the habit of formatting your raw data as an official Excel Table (Ctrl+T). Tables are dynamic and automatically expand to include new rows, which is perfect for any automated process.
A clean dataset is the bedrock of reliable automation. Spending an hour standardizing your source data today will save you dozens of hours troubleshooting a broken report tomorrow.
This disciplined approach is especially crucial in finance, where a single error can have major consequences. If that’s your world, you can get more specific insights on how to automate financial reporting with these principles.
Choosing Your Excel Automation Method
With a clean process in place, you can now pick the right tool for the job. Excel offers several powerful ways to automate, each with its own strengths. The best choice really depends on what you need to do and how comfortable you are with the tech.
Here's a quick comparison to help you decide.
| Method | Best For | Technical Skill Required | Flexibility |
|---|---|---|---|
| Power Query | Importing and cleaning large, messy datasets from various sources. | Low to Medium | High for data transformation, less for UI automation. |
| VBA Macros | Repetitive tasks within Excel, like formatting, copying data, and creating custom functions. | Medium to High | Extremely high; can control almost any aspect of Excel. |
| AIForExcel | Complex analysis, generating summaries, and automating text-based tasks directly in your sheets. | Low | High for analysis and content, integrates with other methods. |
| Office Scripts | Cloud-based automation (Excel for the Web) and integrating with Power Automate. | Medium | Good for cross-application workflows, but newer than VBA. |
Ultimately, many of the best automation solutions actually combine these methods. For instance, you might use Power Query to pull in and clean the data, then a VBA macro to format the final report and email it as a PDF.
Your Pre-Automation Checklist
Before you start building, do a quick "pre-flight" check on your current reporting process. This simple audit helps you spot bottlenecks and opportunities that are easy to miss.
Just ask yourself these four questions:
- Source Reliability: Is my raw data always coming from the same place, in the same format?
- Manual Steps: What are the exact, repeatable actions I take every single time I create this report? Write them down.
- Transformation Logic: What rules do I apply to the data? (e.g., splitting a "Full Name" column, calculating a profit margin).
- Final Output: What is the end goal? A PivotTable? A dashboard with charts? A simple data summary sent as a PDF?
Answering these questions turns a vague idea like "automate this report" into a concrete, actionable plan. This preparation is what separates the automation projects that succeed from those that fail.
Automating Data Cleanup with Power Query

If you're searching for the single most effective way to automate Excel reports, your journey really begins and ends with Power Query. This powerful tool, built right into modern Excel, was specifically designed to tackle the most draining part of any reporting job: getting your data clean, organized, and ready for analysis. Think of it as your secret weapon for building reliable, repeatable reporting workflows that just work.
The real beauty of Power Query lies in how it remembers every single transformation you apply. It's like a macro recorder for your data prep, but you don't need to write a single line of code. Every click—whether you're removing a column, splitting text, or filtering rows—is logged as a step in a sequence that you can run again and again.
A Real-World Scenario: Consolidating Monthly Files
I'm sure this sounds familiar: every month, you get a new CSV file with the latest sales data. Each one is a little different—extra columns here, inconsistent names there, and raw numbers that need calculations. Your task is to wrangle all these files into a single, cohesive master report.
Doing this by hand is a recipe for frustration, filled with endless copying, pasting, and correcting. But with Power Query, you can automate the entire process from start to finish. You just point Power Query to the folder where you save your sales files. It will automatically connect to every file, stack them together, and apply the exact same cleaning steps you defined the first time.
The core idea behind Power Query is simple but incredibly powerful: you define your cleaning process once, and then you let Excel repeat it perfectly, forever. Next month, all you have to do is drop the new file into the folder and hit "Refresh." That's it.
This isn't just about saving time; it's about introducing a level of accuracy and consistency that manual work can never hope to achieve.
Applying Key Transformations Without Code
Once your data is loaded into the Power Query editor, you get a visual interface where you can perform complex data cleaning with just a few clicks. It gives you the power to handle almost any data mess you can imagine.
Here are a few of the most common transformations I use all the time:
- Remove Unnecessary Columns: Easily get rid of visual clutter by selecting and removing columns that aren’t needed for your final report.
- Split Columns: A classic example is separating a "Full Name" column into distinct "First" and "Last" name columns using a space as the separator.
- Filter and Replace Values: Clean up messy text fields by standardizing entries like "USA," "U.S.A.," and "United States" into a single, clean value.
- Calculate New Metrics: Add custom columns with simple formulas, like creating a "Profit" column by subtracting the "Cost" from "Sales."
If you're constantly battling messy data, I highly recommend exploring these features. For a more detailed walkthrough, you can check out our guide on essential data cleaning techniques.
Why Excel Is Still Central to Automation
Even with a growing market of specialized tools, Excel's role in reporting and automation is as strong as ever. Recent statistics on business process automation show that an estimated 58% of finance leaders will still rely on Excel as their primary reporting tool in 2025. People stick with what they know, and Excel’s flexibility is hard to beat.
However, the same data reveals that over 82% of organizations are still leaning on manual processes within Excel, which is a major source of human error and operational risk. This gap highlights a massive opportunity for improvement. By using tools like Power Query, you can automate these manual tasks, consolidate reports, and drastically improve your accuracy.
When you fully embrace Power Query, you're not just learning another Excel feature; you're fundamentally changing how you work. You're building an automated asset that saves hours of tedious work, eliminates errors, and frees you up to focus on what truly matters—analyzing the data, not just preparing it.
Customizing Reports with VBA Macros
While Power Query is an absolute beast for getting your data wrangled and loaded, its job pretty much stops there. What about all the final touches? For things like applying specific formatting, popping in a few charts, or even emailing the finished report, you’ll need to turn to Visual Basic for Applications, better known as VBA.
Think of it this way: if Power Query is the expert crew that preps your ingredients, VBA is the chef that plates the final dish and sends it out to the dining room.
The thought of "coding" in Excel makes a lot of people nervous, but it really doesn't have to be that scary. Excel gives you an incredible built-in tool that does most of the hard work for you: the Macro Recorder. All you have to do is turn it on, go through your usual formatting steps, and Excel will silently write the VBA code behind the scenes, capturing your every click.
It’s the perfect way to dip your toes into automation. Let's say you always apply your company’s branding—setting specific fonts, adding the logo, and resizing columns just so. The Macro Recorder can watch you do it once and turn that entire sequence into a macro you can run again and again.
Your First Step with the Macro Recorder
First things first, you'll need the Developer tab, which Excel hides by default. Once you've enabled it, you just click "Record Macro," give it a memorable name, and start performing those repetitive tasks. When you’re done, click "Stop Recording."
And just like that, you’ve built your first piece of automation. You now have a script that can perfectly replicate those tedious formatting steps with a single click, guaranteeing every report has a consistent, professional finish.
Making Your Macros Smarter
The code from the Macro Recorder is a fantastic starting point, but it's not very flexible. It's static. To truly automate your reports, you need to teach your macros to adapt to new data or different circumstances. This is where a few simple code adjustments can make a massive difference.
For example, your recorded macro might save a file with a very specific name, like C:\Reports\Sales_Report_Jan.pdf. That’s great for January, but it's going to cause problems in February. By introducing a simple variable for the date, you can make the file path and name change automatically.
The real power of VBA is unlocked when you move beyond recording and start teaching your macros to think. A simple variable for a date or file path can transform a one-trick pony into a fully automated reporting workhorse.
Imagine a single macro that doesn't just format your report but handles the entire final-mile process:
- Applies Branding: Sets corporate fonts, colors, and logos.
- Generates Charts: Creates key visuals from your clean data.
- Saves as PDF: Exports the final dashboard into a clean PDF.
- Uses Dynamic Naming: Names the file based on the current month and year, like "SalesDashboard_2024_08.pdf".
This is how you get to true, end-to-end automation. It's about turning a dozen manual clicks and steps into one reliable, automated action that closes out your reporting process perfectly every time.
Supercharging Excel with AI and External Tools

While Power Query and VBA are phenomenal for automating tasks inside Excel, the next real leap in efficiency happens when you connect your spreadsheets to the outside world. This is how you transform Excel from a static file into a dynamic hub for your entire business workflow, building a truly hands-off system for report automation.
This is where AI add-ins and external automation platforms enter the picture. They act as the connective tissue between your raw data in Excel and all the other applications you rely on daily.
Letting AI Write Your Report Summaries
One of the most powerful developments I've seen is embedding conversational AI right into a spreadsheet. Just imagine your sales report refreshes, and an AI immediately analyzes the new figures to generate a clear, narrative summary of what's changed. Instead of you spending 20 minutes poring over the data and writing up key takeaways, the AI handles it in seconds.
Tools like AIForExcel make this a reality. You can literally prompt the AI to "summarize Q3 sales performance compared to Q2 based on this table," and it will spit out a text-based insight you can drop directly into your report or an email to your boss. This genuinely bridges the gap between raw numbers and human understanding. If you're new to this, exploring the fundamentals of how AI for Excel works can open your eyes to a whole new way of working.
Connecting Excel to Your Other Business Apps
Now for the real power move: linking Excel with your other business software. Using platforms like Power Automate or Zapier, you can create workflows that cross application boundaries. These services act as digital middlemen, watching for a trigger in one app and then performing a specific action in another.
A truly automated system doesn't just run inside one program; it seamlessly connects all the tools you use every day. Think of Excel not as the end of the process, but as a central station where data comes and goes automatically.
Let's walk through a common scenario I've set up for many teams:
- The Trigger: A new deal is marked "Closed-Won" in your CRM, like Salesforce or HubSpot.
- Action 1: Power Automate instantly sees this change and grabs the sale details—customer name, deal value, product, etc.
- Action 2: It then adds this information as a new row in your master sales data Excel file, which is saved on OneDrive or SharePoint.
- Action 3: Because the file has changed, it automatically triggers your Power Query connection to refresh, updating your entire dashboard and all its charts.
This entire sequence runs silently in the background, ensuring your report is always current without you ever lifting a finger. This isn't just a clever trick; it's rapidly becoming a standard for efficient operations. The global workflow automation market is projected to swell from $29.9 billion in 2025 to $87.7 billion by 2032, fueled precisely by these kinds of productivity gains. It's clear that connecting your tools is no longer a niche skill but a core business strategy for the future.
Got Questions? Let's Talk Excel Automation
Diving into Excel automation for the first time is exciting, but it almost always comes with a few questions or roadblocks. That's completely normal. Let’s walk through some of the common things people ask when they're just starting out, so you can tackle any issues head-on and feel confident in what you're building.
Where Should I Even Start? Which Method Is Best for Beginners?
For almost everyone, my answer is the same: start with Power Query. I always recommend it as the first step because it tackles the single biggest time-sink in reporting—getting your data cleaned up and ready to use.
The best part is its visual interface. You don't need to be a programmer to make it work; you just click your way through powerful data transformations. Once you've mastered Power Query for all the heavy lifting on the data prep side, then you can start exploring VBA macros to handle the final touches, like applying custom formatting or automatically emailing the finished report.
Can I Automate Reports That Pull Data From a Website?
Absolutely. This is actually one of the coolest things Power Query can do. It has a built-in feature called "From Web" that lets you connect directly to a table on a webpage and pull that information right into your Excel workbook.
Think about it: you set up the connection one time, and from then on, you can refresh the data with a single click or even put it on a schedule. This completely gets rid of the mind-numbing task of copying and pasting from your browser, which is not only slow but also a recipe for errors.
What if My Source Data Is a Complete Mess?
Honestly, messy and inconsistent data is exactly why Power Query was invented. Handling chaotic source files isn't just something it can do; it's what it does best. It's designed to take unstructured, messy information and apply a repeatable series of cleaning steps to turn it into a perfectly organized table, every single time.
Building the cleaning query for a particularly messy file might take a little more time upfront. But remember, you only have to do it once. After that initial setup, the entire cleanup process is automated for every new report, no matter how chaotic the next data dump is.
This "set it and forget it" approach is how you build a truly reliable automated report.
How Do I Stop My Automation From Breaking?
This is a big one. The most common reason an automated report suddenly fails is that something changed in the source data. Someone might rename a column header, move a file, or tweak a date format, and your Power Query or VBA script will immediately throw an error.
Here’s how you can make your automation more resilient:
- Own the Source: If at all possible, create a single source of truth. This could be a dedicated SharePoint folder where files are always dropped or a standardized report exported from your company's CRM. Consistency is key.
- Talk to Your Team: Let the people who supply you with data know how important it is that the file structure stays the same. A quick conversation can save you hours of troubleshooting down the line.
- Build in Error Checks: If you're comfortable with VBA, you can write error-handling code. This allows your script to manage unexpected issues gracefully—or at least send you an alert that something's wrong—instead of just crashing.
At the end of the day, building a durable automation means creating a stable, predictable process from start to finish.
Ready to stop wrestling with formulas and start asking your data questions? AIForExcel integrates a conversational AI directly into your spreadsheet, letting you generate insights, summarize reports, and clean data using simple English. Get started in two minutes and see how over 4,800 professionals are making smarter decisions, faster. Learn more and try AIForExcel today.